

Gold Liquidity Sweeps: Reading False Breakouts Around Key Levels
Learn to describe gold liquidity sweeps objectively, distinguish failed breaks from assumptions about intent, and define testable XAU/USD observations.
Gabriel Nicolaev – CyGuru · 29 October 2026 · 3 min read
In this guide
Describe what happened before explaining why
Traders often call a brief move beyond a previous high or low a liquidity sweep. The chart directly shows prices and their sequence; it does not reveal every participant’s orders or motives. A wick through a high followed by a close below it is observable. A claim that a particular institution hunted stops is a separate explanation requiring evidence that an ordinary candle chart cannot provide.
Specify the reference level in advance
Choose an objectively identifiable reference: the previous session high, a prior-day low or a swing defined using a fixed number of completed bars. Record the level before the alleged sweep. Do not move the reference afterwards to make the picture cleaner. Different feeds may print slightly different extremes, so keep provider, quotation type and timeframe attached to the example.
Separate a crossing from a rejection
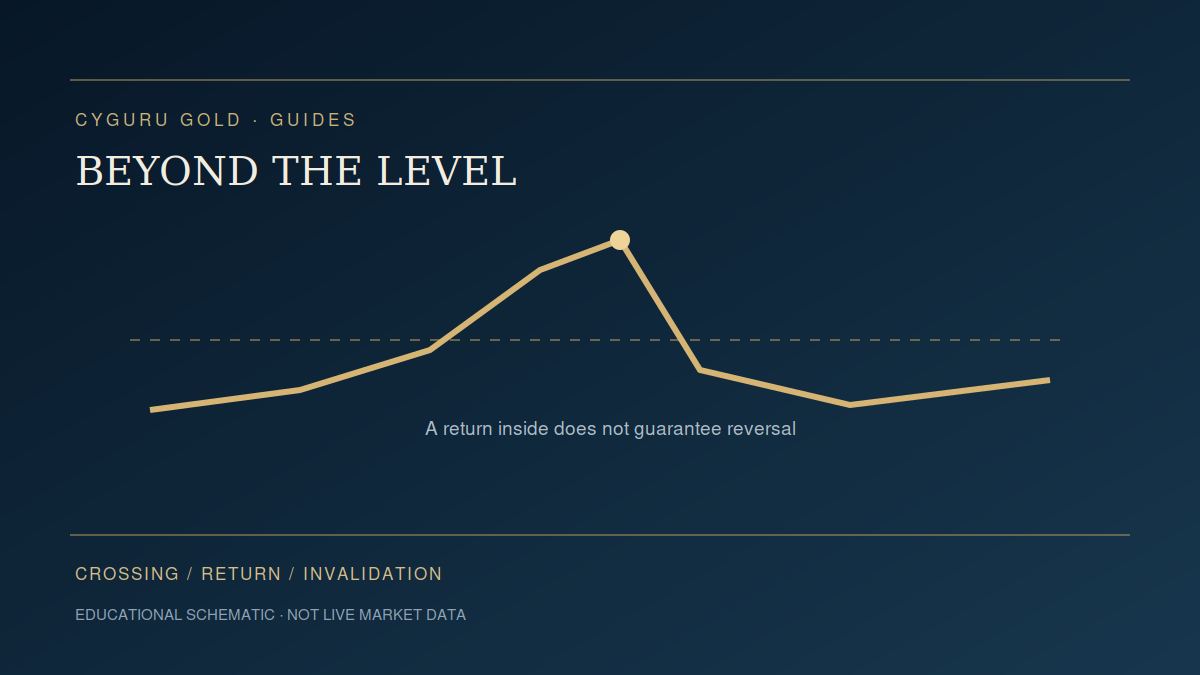
One possible study definition requires a trade beyond the reference followed by a completed close back inside within three bars. Another requires two closes. Neither definition is inherently validated. The choice changes the sample and must remain fixed through the test. Record the distance beyond the level and time spent outside it. A brief crossing and prolonged acceptance should not be placed in the same bucket without explanation.
A hypothetical sequence
Assume a pre-recorded high of 2,000. Price prints 2,003 and the completed observation bar closes at 1,998. That satisfies a simple close-back-inside definition. It says nothing yet about the next direction. If the following bars climb above 2,003, the rejection hypothesis may fail. Include these failures in the study rather than reclassifying them as a different pattern after the outcome is known.
Why a wick is not an executable trade record
A reversal entry requires a stated order and a price available after confirmation. Entering retrospectively at the wick extreme uses information the trader did not possess at that moment. A stop beyond the extreme can also execute worse than planned. For bid-only histories, the ask side may affect both entry and stop triggers. Document these limitations before estimating risk or reward.
Measure outcomes without flattering the pattern
Track the number of eligible references, number of qualifying returns inside, subsequent favorable excursion and adverse excursion over a fixed horizon. Count overlapping signals consistently. Compare the pattern against a simple baseline using the same hours and volatility conditions. A visually memorable reversal may be rare, while small failed examples dominate the actual sample.
Where this fits in the process
Use the breakout guide to distinguish a temporary excursion from continued acceptance. Use ATR as a scale for comparing excursion distances across changing conditions, without treating an ATR multiple as a prediction. The final decision belongs to a written process that includes the possibility of no trade. A compelling label is not evidence of a durable advantage.
Follow a connected reading path
Sources and definitions
Source links support the definitions and background identified in this guide. Study protocols and invented examples are original educational analysis, not validated trading results.
The Gold Trader’s Code
Explore the wider framework and available formats in the author’s store.
View on CYGURU.COM →Connect your reading
- Gold Breakout or Fakeout? A Framework for Evaluating the Move
- Gold Volatility and ATR: Sizing Stops for Changing Conditions
- How to Backtest a Gold Trading Strategy Without Fooling Yourself
Explore Research Lab → · Trading Toolkit → · Prepare your session →
Education, not personalized advice or a validated prediction model. Hypothetical calculations exclude costs unless specified.