

Gold Volatility and ATR: Sizing Stops for Changing Conditions
Understand true range, ATR smoothing and volatility-based gold risk estimates, with a worked position-size example and explicit execution limitations.
Gabriel Nicolaev – CyGuru · 29 October 2026 · 3 min read
In this guide
ATR measures magnitude, not direction
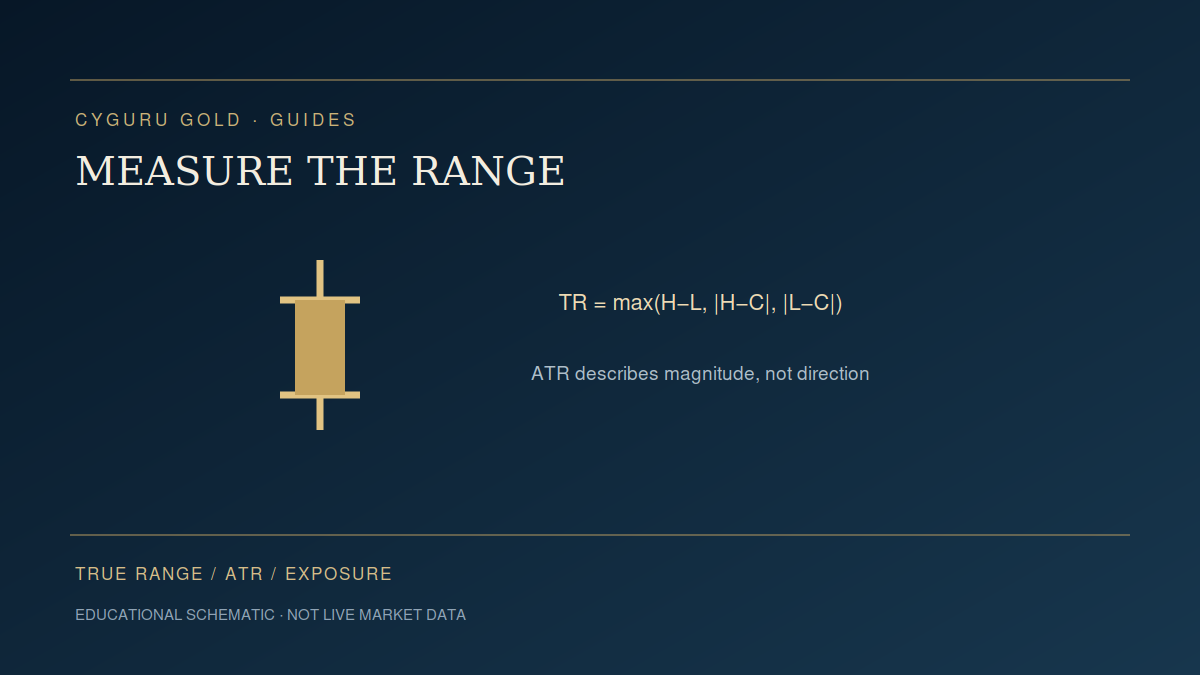
Average True Range summarizes recent price-range magnitude in the units of the instrument. It does not forecast whether gold will rise or fall, and it does not represent a guaranteed maximum move. A rising ATR can accompany an advance, decline or disorderly sideways market. The timeframe, lookback and smoothing method are part of the measurement and should appear beside any reported value.
Calculate true range correctly
For a bar with high H, low L and previous close C, true range is the maximum of H minus L, the absolute value of H minus C, and the absolute value of L minus C. If H is 2,012, L is 2,004 and C is 2,000, true range is 12 rather than the intrabar range of 8. These invented numbers show why previous-close gaps matter.
State the averaging convention
ATR applies an averaging method to the true-range sequence. Wilder-style smoothing updates the previous average using one nth of the difference between current true range and the previous average; the initialization also matters. TradingView documents RMA as its default, with other smoothing choices available. Two platforms can therefore produce different ATR values even when the label and lookback appear similar.
Translate distance into monetary exposure
In a hypothetical ounce-based instrument, an ATR of 8 dollars and a chosen multiplier of 1.5 imply a 12-dollar stop distance. If a study risk budget is 120 dollars and an additional estimated cost allowance is 2 dollars per ounce, the continuous size estimate is 120 divided by 14, about 8.57 ounces. Round down to the provider’s permitted size increment and recheck the resulting exposure.
Do not silently substitute lots for ounces
A broker lot, a futures contract and an ounce are not interchangeable units. Use the actual contract multiplier, tick value and minimum quantity. The general estimate divides the risk budget by planned price-distance loss per unit plus estimated costs per unit. Account-currency conversion and fixed fees may require a separate calculation. Leverage changes margin requirements; it does not remove price risk.
Volatility adapts after the shock
An average can lag a sudden change. The first large event move can occur while ATR still reflects quieter bars. A planned stop can slip, especially around releases or gaps, making the realized loss exceed the budget. Avoid presenting an ATR-based size as a maximum-loss guarantee. Compare normal and stressed cost assumptions before treating a hypothetical setup as feasible.
Test sensitivity rather than worship one multiplier
Compare a small, predeclared set of lookbacks and multipliers on a development sample, then freeze the choice for a later evaluation. Report trade count, net expectancy and drawdown for neighboring parameter values. A rule that works only at one precise setting is fragile. Connect the calculation to the Trading Toolkit and retain the assumptions in the journal.
Follow a connected reading path
Sources and definitions
Source links support the definitions and background identified in this guide. Study protocols and invented examples are original educational analysis, not validated trading results.
The Gold Trader’s Code
Explore the wider framework and available formats in the author’s store.
View on CYGURU.COM →Apply this framework to dated research
Connect your reading
- Trading Gold Around Economic Releases: Spreads, Slippage and Execution Risk
- How to Backtest a Gold Trading Strategy Without Fooling Yourself
- The Gold Trading Journal: Measure Decisions, Not Just Profit
Explore Research Lab → · Trading Toolkit → · Prepare your session →
Education, not personalized advice or a validated prediction model. Hypothetical calculations exclude costs unless specified.