

Gold and Silver Divergence: What Relative Strength Can—and Cannot—Tell You
Compare gold and silver returns, calculate the gold–silver ratio and understand why divergence alone cannot validate a relative-value trade.
Gabriel Nicolaev – CyGuru · 29 October 2026 · 3 min read
In this guide
- Compare returns before comparing chart shapes
- Understand the ratio arithmetic
- Relative strength is a description
- Separate possible drivers from established explanations
- A two-leg trade carries two sets of assumptions
- Design a study with an exit and a failure condition
- Use divergence as a research question
Compare returns before comparing chart shapes
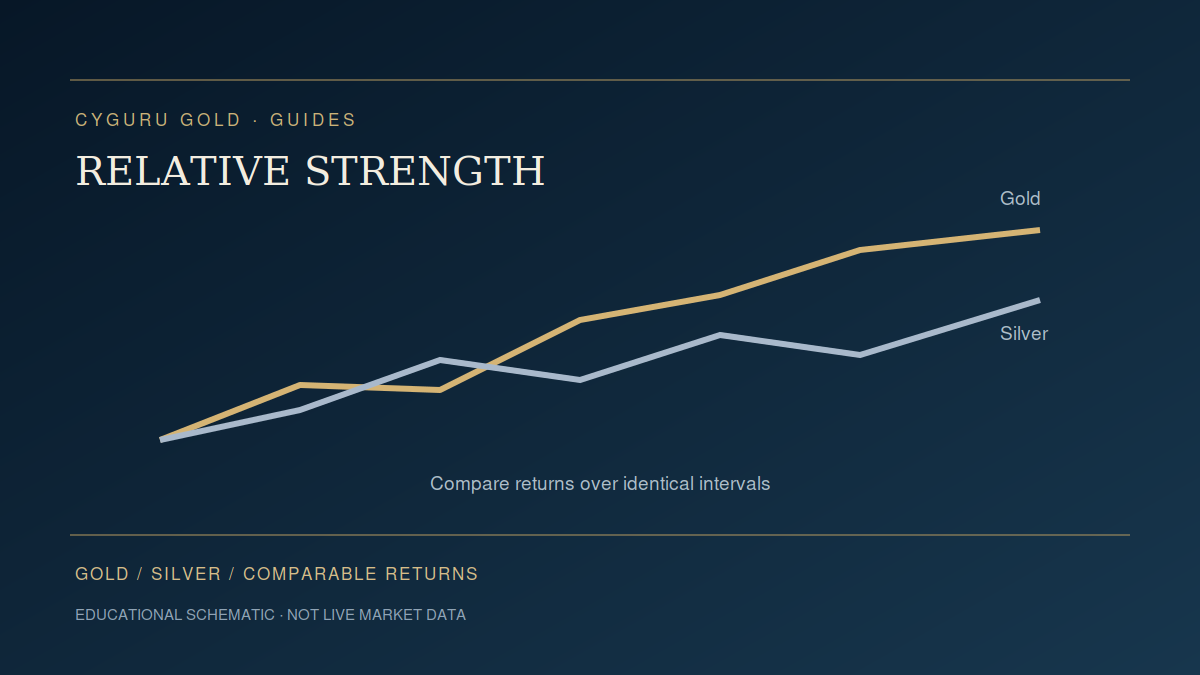
Gold and silver have different price scales. A one-dollar change is not comparable across them. Measure percentage returns over the same interval with synchronized timestamps and the same quotation currency. Rebase both series to a common starting value if plotting them together. A chart that appears to diverge because its axes were independently adjusted is weak evidence of relative strength.
Understand the ratio arithmetic
The gold–silver ratio divides the price of an ounce of gold by the price of an ounce of silver in the same currency. In a hypothetical example, gold at 2,000 and silver at 25 produce a ratio of 80. If gold gains 2% while silver gains 5%, the ratio becomes 80 multiplied by 1.02 divided by 1.05, approximately 77.71. Both metals rose while the ratio fell.
Relative strength is a description
A rising ratio says that gold outperformed silver over the measured interval. It does not show that silver must catch up or that the ratio has reached a natural ceiling. A historical average depends on sample dates and may hide structural changes. Define the comparison window and the question before identifying an apparently extreme reading.
Separate possible drivers from established explanations
Gold and silver share some monetary and precious-metal influences, while their demand profiles and market conditions differ. Those differences can motivate research, but they do not explain an individual divergence without evidence. Compare relevant demand research, currency conditions and positioning rather than selecting a single story after viewing the result. Correlation is descriptive and can change across regimes.
A two-leg trade carries two sets of assumptions
Buying one metal and selling another introduces sizing, financing and execution issues on both legs. Equal ounces do not create equal dollar exposure; equal dollar exposure does not guarantee equal risk. Correlations and volatility estimates can change. One leg can execute before the other, and contract rolls can matter for futures. The ratio chart itself contains none of those implementation costs.
Design a study with an exit and a failure condition
Specify the entry threshold, lookback, position sizing method, maximum holding period and stop or invalidation condition. Compare net outcomes with a baseline and retain prolonged divergences that failed to revert. Avoid choosing historical peaks by eye. Any claimed mean-reversion effect needs evidence on later observations using the original rule and realistic costs.
Use divergence as a research question
A practical journal entry asks which metal moved first, whether the timestamps match, and whether the difference survives alternative windows. It does not convert disagreement between two charts into an automatic gold signal. Connect this analysis to the crisis guide and Research Lab. Keep each feed separate until its quotation and data quality are understood.
Follow a connected reading path
Sources and definitions
Source links support the definitions and background identified in this guide. Study protocols and invented examples are original educational analysis, not validated trading results.
Gold Trading Mastery
Explore the wider framework and available formats in the author’s store.
View on CYGURU.COM →Apply this framework to dated research
Connect your reading
- Why Gold Can Fall During a Crisis: Liquidity, Margin Calls and Forced Selling
- How to Backtest a Gold Trading Strategy Without Fooling Yourself
- Gold, rates and the dollar: identify the variable first
Explore Research Lab → · Trading Toolkit → · Prepare your session →
Education, not personalized advice or a validated prediction model. Hypothetical calculations exclude costs unless specified.