

Support and Resistance in Gold: Building Zones That Matter
Build reproducible support and resistance zones for gold. Learn timeframe selection, zone invalidation and how to avoid hindsight in XAU/USD analysis.
Gabriel Nicolaev – CyGuru · 29 October 2026 · 3 min read
In this guide
A zone is an observation framework
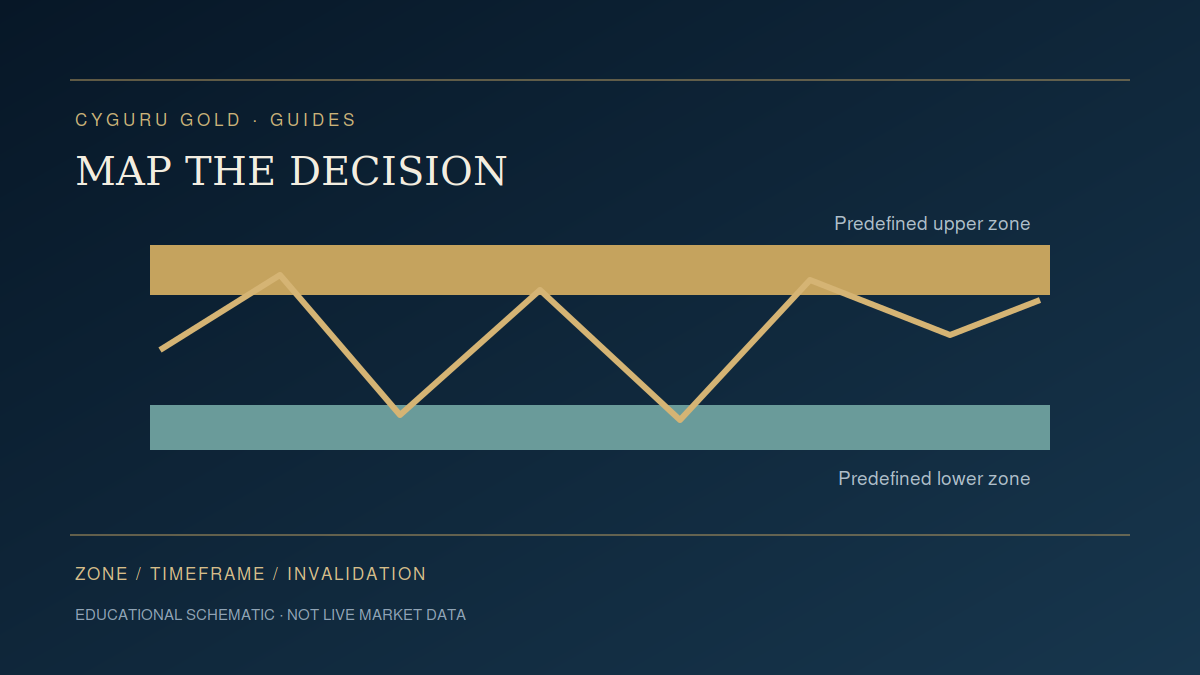
Support and resistance describe areas where past trading activity may influence later decisions. They are not barriers that price is obliged to respect. Use zones to organize a question: what would acceptance, rejection or failure look like here? A chart becomes less useful when every small turn is turned into a level and the trader can explain any possible outcome afterwards.
Choose the timeframe to match the decision
A daily reference can frame the broader market while a shorter timeframe supplies execution information. Keep their roles distinct. A short-term fluctuation through a daily zone is not automatically a daily failure. Define the timeframe used to construct the zone and the timeframe used to judge it. Save both with the original screenshot so the explanation cannot shift after a loss.
Make the construction reproducible
Possible references include prior-day highs and lows, completed range boundaries or mechanically defined swings. If a swing requires two later bars for confirmation, it becomes available only after those bars close. Drawing it earlier in a historical test introduces future information. Define zone width using a fixed rule, such as a price distance or volatility fraction, and keep that rule consistent.
An example with explicit boundaries
Suppose the chosen method creates a hypothetical resistance zone from 2,000 to 2,004. Record the date of construction and its expiry condition. A print at 2,002 is inside the zone; a completed close at 2,006 is outside. Whether that close counts as failure depends on the rule. The zone should not be widened to 2,008 simply because price crossed the original edge.
Repeated touches need careful interpretation
Multiple visits may attract attention, consume available orders or reflect a continuing balance. Candles alone cannot settle which mechanism dominates. Count touches using a minimum separation rule rather than treating adjacent bars as independent tests. A zone that survives several visits is not automatically stronger, and a zone that fails once need not permanently reverse its role.
Reduce clutter with a relevance rule
Limit the active set by proximity, age, timeframe and the purpose of the session. For example, retain the nearest relevant zone above and below price plus the prior-day extremes. This is a workflow choice, not a proven strategy. Archive inactive zones instead of deleting unfavorable history. An uncluttered screen should improve decision clarity without erasing evidence.
Connect levels to risk and review
A zone provides context for a scenario; position sizing still requires a defined entry, exit assumption and contract specification. Record whether the trade began inside, near or far from the zone. Review both successful and failed interactions. Continue with the breakout and sweep guides, which turn broad visual ideas into observations that can be counted and challenged.
Follow a connected reading path
Sources and definitions
Source links support the definitions and background identified in this guide. Study protocols and invented examples are original educational analysis, not validated trading results.
Gold Trading Mastery
Explore the wider framework and available formats in the author’s store.
View on CYGURU.COM →Connect your reading
- Gold Breakout or Fakeout? A Framework for Evaluating the Move
- Gold Liquidity Sweeps: Reading False Breakouts Around Key Levels
- Gold Volatility and ATR: Sizing Stops for Changing Conditions
Explore Research Lab → · Trading Toolkit → · Prepare your session →
Education, not personalized advice or a validated prediction model. Hypothetical calculations exclude costs unless specified.