

SELECTED CASE · CY66 · 15-MINUTE BREAKOUT
Beyond the Third Target: 66 Breakout Captures Gold’s Upside Expansion
A defined BUY setup, an expansion above the third target, and the evidence I want to preserve.

This is the science I am developing. State the setup, preserve its levels, and measure what the next observation actually shows.
The breakout I am recording
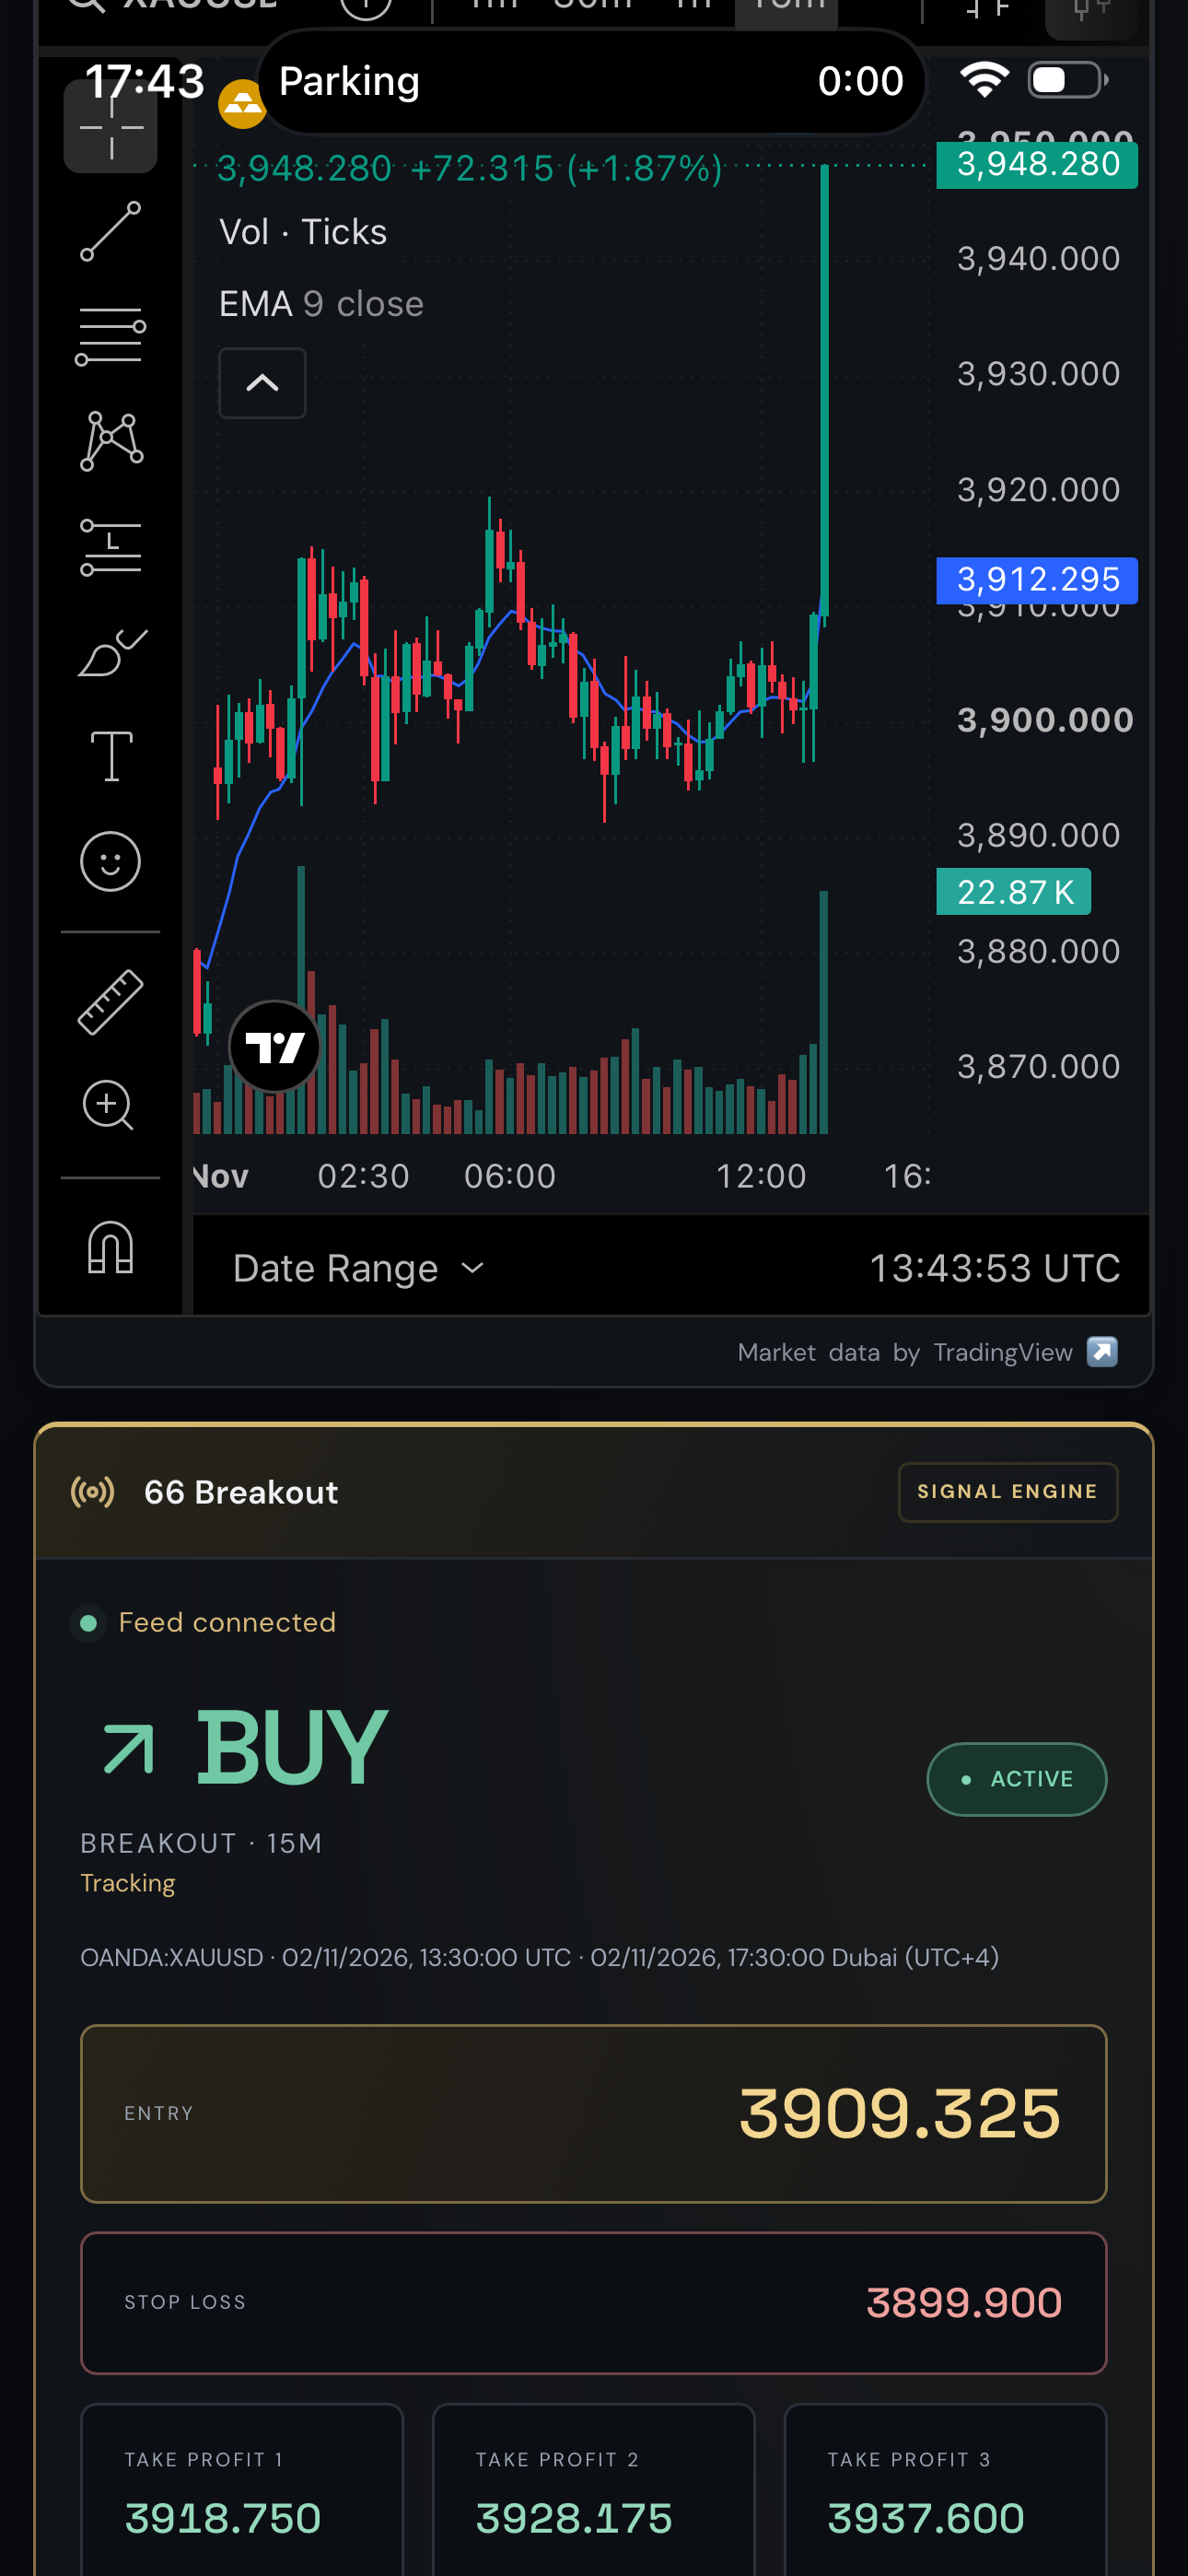
On 2 November 2026, my CY66 dashboard displayed a 66 Breakout BUY for OANDA:XAUUSD on the 15-minute timeframe. Its recorded time was 13:30 UTC, or 17:30 in Dubai. The reference entry was 3,909.325, with a stop at 3,899.900. Three upside targets were already displayed on the card.
The supplied capture shows a chart quote of 3,948.280. That is above the first target of 3,918.750, the second target of 3,928.175 and the third target of 3,937.600. It documents a favorable upside observation for this particular setup. The card remains labelled ACTIVE / Tracking. I am preserving that status alongside the price comparison.
The levels and their arithmetic
| Field | Displayed level | Distance from entry |
|---|---|---|
| BUY entry | 3,909.325 | Reference |
| Stop loss | 3,899.900 | −9.425 · −1R |
| TP1 | 3,918.750 | +9.425 · 1R |
| TP2 | 3,928.175 | +18.850 · 2R |
| TP3 | 3,937.600 | +28.275 · 3R |
| Captured quote | 3,948.280 | +38.955 · approximately 4.133R |
The initial reference risk is 3,909.325 − 3,899.900 = 9.425 per ounce. The quote stands 10.680 above TP3. The distance from entry to the captured quote is 38.955 per ounce, approximately 4.133 times the initial reference risk. These calculations describe the position of the captured quote relative to the planned levels. A trader’s account return also depends on position size, fills, spread, commissions, financing and any partial exits.
Read the two clocks together
The chart clock reads 13:43:53 UTC. Relative to the signal timestamp, the displayed observation is thirteen minutes and fifty-three seconds later. This elapsed time locates the capture. It does not establish the first time a target was crossed. Publication is later still, with its actual Dubai and UTC time recorded above.
The capture falls within the 15-minute interval beginning at 13:30. If that is the bar’s opening time on this feed, its final high, low and close would only be established after the interval completes. A large rising candle can be a useful observation while it is forming. Its shape at the capture time should remain distinct from a completed candle imported into a historical test.
Why the expansion interests me
The visible chart shows repeated trading around the 3,900 area before a sharp upward expansion. My interpretation is that this is the kind of transition a breakout engine should investigate. A period of two-way movement gives way to a move that covers several reference risk units. The signal’s displayed entry places a testable starting level near the expansion.
To evaluate the engine itself, I would need the exact rule version and the archived alert as it first arrived. The screenshot alone does not establish when the signal became available to a subscriber, whether it was calculated intrabar or at a close, or whether earlier values changed. These details determine whether a later researcher can reproduce the same opportunity using only information available at the time.
What would complete the outcome record?
I would preserve timestamped prices from the same feed between the signal and each exit, then resolve whether the stop was touched before the targets. A quote above TP3 supports this selected observation. An execution result needs an order and fill record as well. The screenshot does not independently certify that sequence or a broker exit.
The captured quote is beyond TP3, which documents the favorable third-target price comparison. The signal card still displays ACTIVE / Tracking and has no visible closed-result badge. This edition therefore records a quote above all three targets with the displayed status retained. A later lifecycle or execution record can establish the final evaluated outcome.
The original evidence
Keep the research question measurable
This is one selected favorable example. To estimate the engine’s reliability, I would include every eligible 66 Breakout signal over a defined period, with the same costs, expiry rules and treatment of ambiguous price bars. Losing, unresolved and overlapping signals belong in that record. This case supplies no overall win rate.
Today’s question is narrow and useful. Did the displayed BUY reference precede an observed price above its third target? The supplied timestamped image records those levels together. The next research step is to reconstruct their sequence from the original alert and market data, then apply that test consistently across the full sample.
Continue the investigation
Read the signal evaluation methodology, compare stop and target ordering inside one candle, and study gold backtesting. The position and risk tools help translate reference risk into a position. Explore the CyGuru trading books, Gold Intelligence and reader updates, or inspect the CY66 dashboard ↗.
Source record supplied by the author, who develops and promotes CY66 and CyGuru educational products. Evidence cutoff 2 November 2026, 13:43:53 UTC. Selected observation above TP3. Independently verified execution unavailable.