

CASE 002 · CY66 · 15-MINUTE CHOCH
Beyond the Third Target: Gold’s Selloff and a Reported CY66 TP3
A reported third-target success, the mathematics behind the move, and the inflation backdrop worth examining.

This is the science I am developing: define the hypothesis, record the risk, and examine the outcome without confusing a favorable move with complete proof.
The result I am documenting
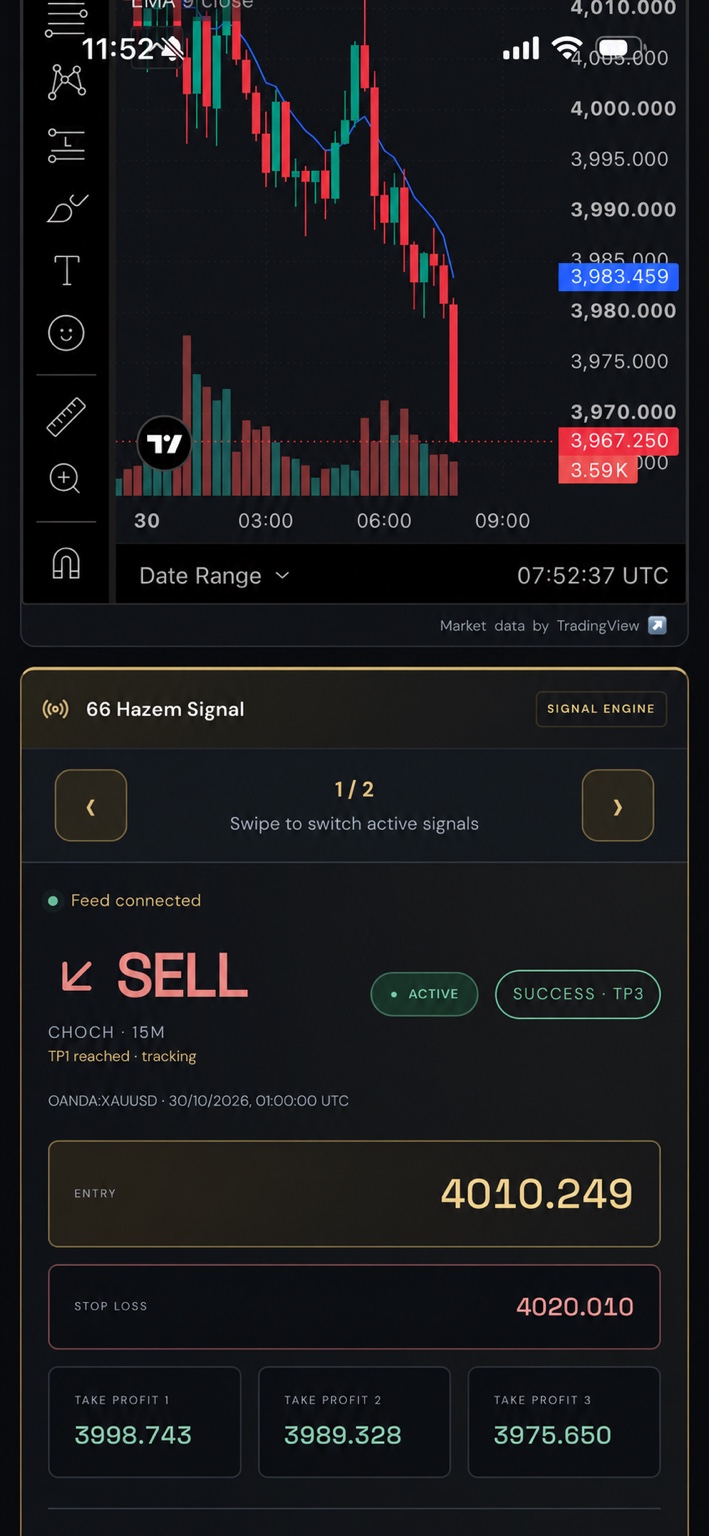
My CY66 signal dashboard showed a SELL setup on OANDA:XAUUSD, labelled “66 Hazem Signal” and “CHOCH · 15M,” at 01:00 UTC on 30 October. I am recording this as a reported TP3 success. The supplied capture displays a quote of 3,967.250, below the third target of 3,975.650. That is a favorable price observation for the displayed short setup.
The distinction matters: this is an intraday observation from Friday’s trading, not a completed New York session review. The capture’s clock is 07:52:37 UTC. It does not establish the exact time TP3 was first crossed, the closing price of the final candle, or an executed exit at the target.
The levels and the risk
| Field | Price | Distance from entry |
|---|---|---|
| SELL reference entry | 4,010.249 | — |
| Stop loss | 4,020.010 | 9.761 adverse |
| TP1 | 3,998.743 | 11.506 favorable · 1.179R |
| TP2 | 3,989.328 | 20.921 favorable · 2.143R |
| TP3 | 3,975.650 | 34.599 favorable · 3.545R |
| Quote displayed | 3,967.250 | 42.999 favorable · 4.405R |
The reference risk is 4,020.010 − 4,010.249 = 9.761. The third target is 34.599 below entry, so its planned reward-to-risk ratio is approximately 3.545:1 before costs. The displayed quote is another 8.400 below TP3. These are comparisons between printed prices, not broker returns. Taking partial profits at earlier targets would produce a different total outcome; spread, commissions, slippage, size and actual fills are not supplied.
What the evidence can and cannot settle
The card shows “SUCCESS · TP3,” but also “ACTIVE” and “TP1 reached · tracking.” I am preserving that inconsistency rather than silently resolving it. The image was supplied by the owner and has not been independently authenticated against an original signal log. Its status badge is therefore a reported result, not independent verification.
Most importantly, the image does not give the complete price path from entry. It cannot rule out the stop having been reached before a later decline through the targets. A robust evaluation needs the original timestamped signal, uninterrupted bid/ask data, target-versus-stop ordering rules and execution assumptions. Until then, this remains a selected favorable observation, with execution and sequence unverified.
The news timeline around the move
There was a credible macroeconomic backdrop to the selling, but saying that one headline “produced” this exact TP3 would go beyond the available evidence. Here is the information timeline:
- 28 October · 18:00 UTC / 22:00 Dubai: the Federal Reserve held its policy range at 3.75–4.00%. Two dissenters preferred a quarter-point increase. The decision itself was a hold, not a rate hike.
- 29 October · 12:30 UTC / 16:30 Dubai: the BEA’s September Personal Income and Outlays release showed PCE inflation of 0.5% month over month and 3.6% year over year. Excluding food and energy, the increases were 0.3% and 3.1%. This was prior-day information by the time the signal appeared.
- 30 October · signal at 01:00 UTC: the supplied signal record places the short setup after both releases. It is not evidence of predicting an unreleased economic number.
- 30 October · market observation at 05:11 UTC: a Reuters report republished by Business Recorder put spot gold at $4,000.54, down 0.5%, and described higher oil and persistent inflation as supporting expectations of a later Fed hike. Its market timestamp precedes the supplied chart clock; its spot quote is not the same timestamp or feed as the screenshot.
My interpretation: inflation has more than one channel
Gold can attract demand as an inflation hedge, yet an inflation release can also weigh on it if investors expect tighter monetary policy. The relevant question is which channel dominates at that moment. Higher expected rates can increase the opportunity cost of holding a non-interest-bearing asset. Oil-led inflation can therefore coexist with a falling gold price; there is no universal rule that inflation news must send gold higher.
That is a plausible framework for this move, not a measured causal attribution. The central bank decision and PCE report were already known, and the short setup was a technical signal. To demonstrate an incremental news effect, I would need precise headline arrival times, synchronized gold, dollar and yield series, and comparisons with similar periods without those events.
I do not have a verified, synchronized DXY or Treasury-yield observation at the capture’s 07:52:37 UTC timestamp. I therefore cannot claim that a rising dollar or rising yields caused the final red candle. Nor does the screenshot establish liquidation flows, order-book depth or who was selling. Those remain questions for the next stage of the investigation.
What I want to test next
The next useful step is to reconstruct every closed 15-minute candle between signal creation and the capture, then use finer data wherever stop and target could both have been touched. I would compare this CHOCH setup with all signals generated under the same rules, including failures and unresolved cases. Testing only the winners would answer the wrong question.
I also want to compare results across inflation-release days and ordinary sessions, using the information available at signal time. The evaluation methodology explains the evidence needed; the Research Lab provides candle-analysis tools. Read the gold, rates and dollar guide for the macro framework, and use the risk tools before converting a price-distance ratio into a position. My wider educational approach is collected in the CyGuru trading books.
A third-target observation is worth documenting. The lasting value comes from a repeatable evaluation process that treats favorable and unfavorable outcomes equally. This article records one case; it does not establish the system’s win rate or promise the next result.
Educational historical case study. The author develops and promotes CY66 and CyGuru educational products. Reported signal result; independently verified execution unavailable. Source information checked on 30 October 2026; the supplied market observation ends at 07:52:37 UTC.