

RESEARCH REVIEW · 30 OCTOBER 2026 · CY66
Four Gold SELL Signals, One Market: A 30 October Research Review
Three cards marked SUCCESS TP3 and one marked SUCCESS TP2. A closer look at what today’s selected gold signals show—and how their shared market exposure changes the interpretation.

This is the science I am developing: recording each signal clearly, then asking what the evidence actually establishes. A favorable outcome is worth documenting; the method used to evaluate it must remain consistent.
The four records in today’s snapshot
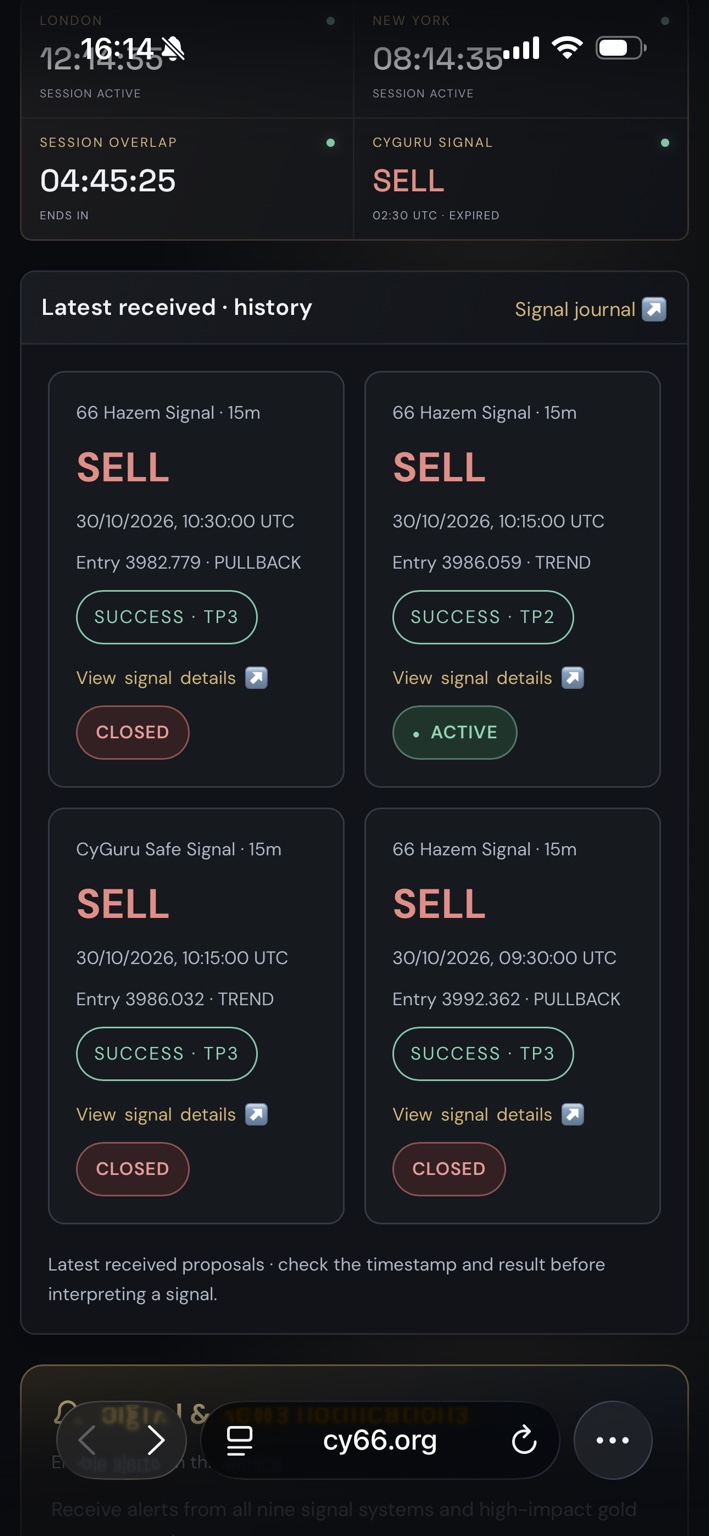
The latest-received history panel supplied from CY66 displays four 15-minute SELL records. Three carry a SUCCESS TP3 badge and are marked CLOSED. The fourth carries SUCCESS TP2 and remains ACTIVE. This article records those displayed outcomes as a selected intraday review, not as the final result of the New York session.
| Signal / setup | Signal time UTC / Dubai | Entry | Reported outcome |
|---|---|---|---|
| 66 Hazem · PULLBACK · SELL | 09:30 / 13:30 | 3992.362 | TP3 · CLOSED |
| CyGuru Safe · TREND · SELL | 10:15 / 14:15 | 3986.032 | TP3 · CLOSED |
| 66 Hazem · TREND · SELL | 10:15 / 14:15 | 3986.059 | TP2 · ACTIVE |
| 66 Hazem · PULLBACK · SELL | 10:30 / 14:30 | 3982.779 | TP3 · CLOSED |
The order above follows the signal timestamps. The original panel places the latest record first. A signal time identifies the record’s stated creation time; it does not tell us when a target was reached. The screenshot provides no target-hit timestamps for these four cards.
What I find useful about this sequence
There are both TREND and PULLBACK labels in the same one-hour window. The reference entries move from 3992.362 at 09:30 UTC to 3982.779 at 10:30 UTC. That is a difference of 9.583 between the first and last listed entries. It describes the recorded entry sequence, not a continuous price path or a verified trade return.
My interpretation is that this is a useful cluster for studying how differently labelled setups respond to the same market episode. The history panel alone does not reveal the rules behind either label. I cannot infer the indicator thresholds, alert delivery latency, or actual execution decisions from those labels.
The two 10:15 UTC records are particularly interesting: their entries differ by only 0.027. One is now reported at TP3 and closed; the other is reported at TP2 and still active. That difference does not establish that one model is better. The history cards omit their stop distances, target definitions and management rules. Different objectives can produce different status badges even when the starting prices are almost identical.
One existing case, now seen in the broader journal
The CyGuru Safe entry at 3986.032 is the same record discussed in From TP2 to TP3: CyGuru Safe Signal’s Gold Selloff Update. Its original TP2 observation and later CLOSED / TP3 capture remain available there. This roundup adds the surrounding journal context; it does not create another winning trade from that same signal.
Likewise, the earlier 01:00 UTC Hazem case is a different record and is not one of the four cards in this image. Keeping timestamps and reference entries attached to each case helps avoid confusing several screenshots with several independent trades.
Why four favorable cards are not four independent tests
All four records share the SELL direction and the 15-minute timeframe. Their timestamps are close together. A common downward episode can support several such signals at once. That makes this an informative cluster, but a limited test of performance across market regimes.
Three TP3 badges out of four displayed cards is a description of this selected panel, not a 75% strategy win rate. The fourth card is not a recorded loss: it remains active with TP2 reported. More importantly, this image does not contain the full population of signals, including losses, expired proposals and unresolved records. No aggregate win rate or account profit can be calculated from it.
What the evidence does—and does not—contain
The supplied screenshot contains model names, setup labels, signal times, entries and reported status badges. It does not show the full stop and target levels for the Hazem records, their intervening price histories, or broker fills. I therefore do not calculate their reward-to-risk ratios or add up a total return.
“CLOSED” is the platform status shown in the image, not independent confirmation of a broker transaction. Verification would require the original timestamped signal record, an unchanged evaluation rule, the complete subsequent price sequence and execution assumptions. In particular, a target label cannot resolve whether a stop was touched first without the underlying data.
The next research step
I want each record linked to its original alert, exact target and stop values, first-touch timestamps and any revisions. A complete evaluation should use the same cost and ambiguity rules for every outcome. It should also group overlapping signals so that shared market exposure remains visible.
This screenshot introduces no timestamped economic release or news source. I do not assign a new news cause to the reported results. A separate event study would need verified release times and synchronized gold, dollar and yield observations. Technical labels and a successful badge alone cannot establish causation.
Readers can examine the evaluation methodology, explore the Research Lab tools, and follow the gold backtesting guide. My wider educational framework is available in the CyGuru trading books. The aim is a research record that becomes more useful as evidence accumulates, including outcomes that do not support the original idea.
Selected historical signal review. Three TP3 outcomes and one active TP2 are reported by the supplied panel, not independently verified executions. The author develops and promotes CyGuru signals and educational products. This is not a current instruction to trade.