

CASE 001 · CY66 · 15-MINUTE REVERSION
From Signal to Evidence: 66 Reversion on Gold
This is the science I am developing.

“This is the science I am developing: a process that turns a stated signal into a timestamped hypothesis, defined risk and a reviewable observation.”
The setup: a defined hypothesis
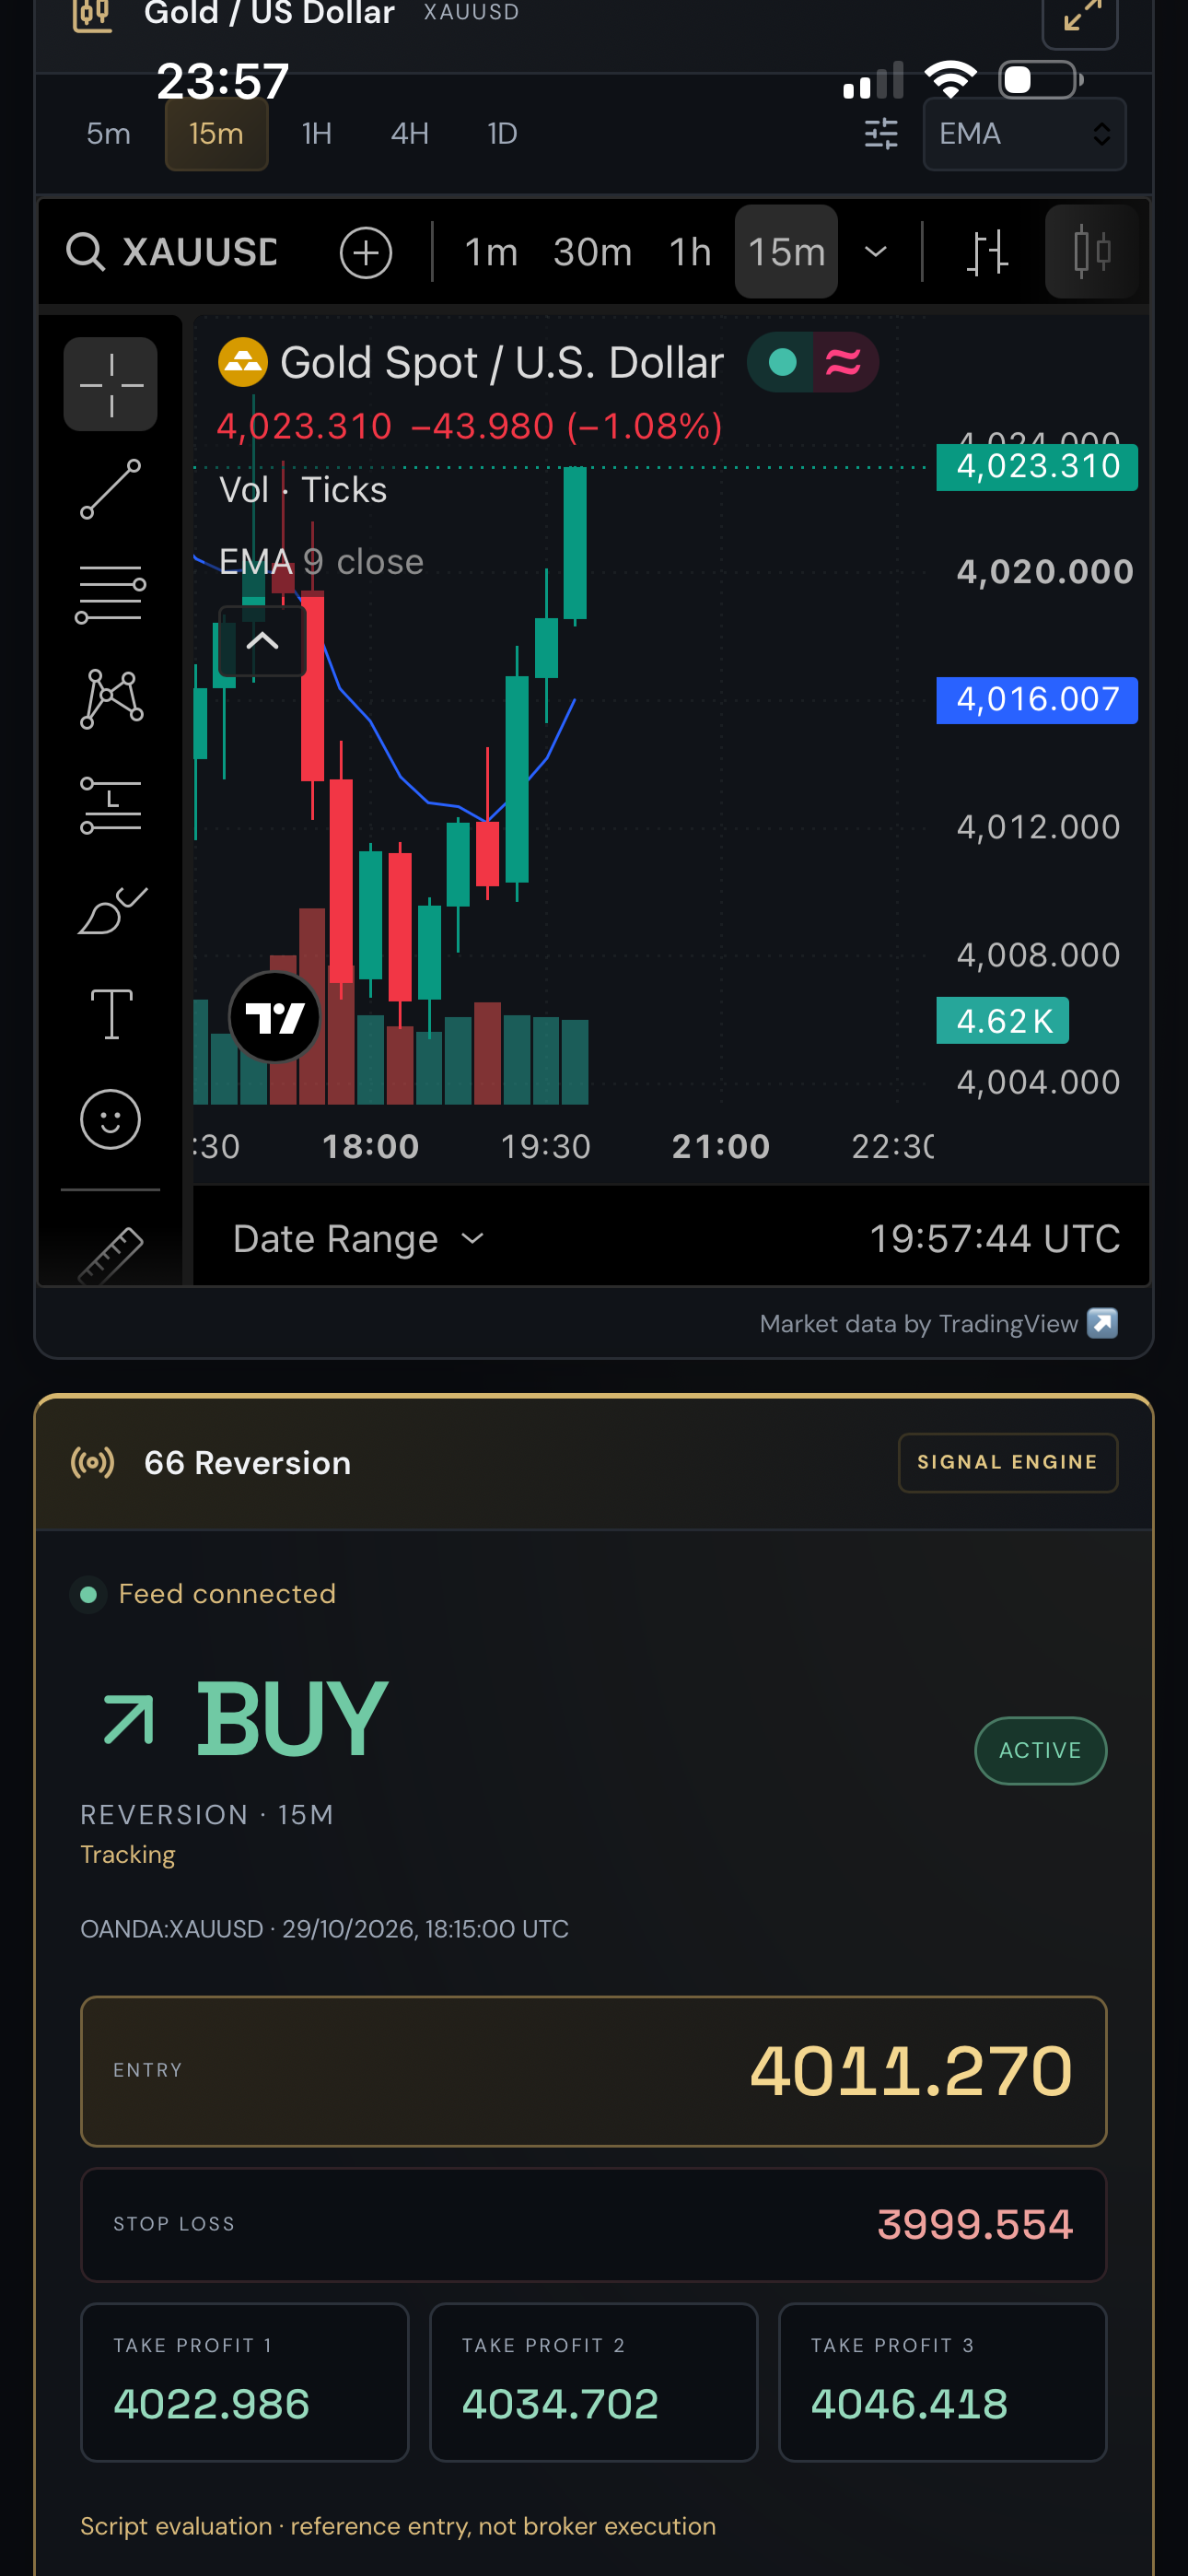
On 29 October 2026, the CY66 dashboard displayed a 66 Reversion BUY signal for OANDA:XAUUSD on the 15-minute timeframe. The signal timestamp was 18:15 UTC, or 22:15 in Dubai. Rather than describing a move only after it happens, my aim is to record the reference entry, the invalidation level and the targets so that the idea can be examined.
| Signal field | Displayed value |
|---|---|
| Reference entry · BUY | 4,011.270 |
| Stop loss | 3,999.554 |
| Take profit 1 | 4,022.986 |
| Take profit 2 | 4,034.702 |
| Take profit 3 | 4,046.418 |
| Quote shown in the capture | 4,023.310 |
What the capture shows
The displayed quote of 4,023.310 is 0.324 above the first target. This is the favorable observation documented in this first case. The chart clock reads 19:57:44 UTC; this is the clock shown in the capture, not the article’s publication time. The signal card still reads ACTIVE / Tracking.
The evidence supports the statement that the displayed quote was above TP1. It does not establish a closed trade, a broker fill or the sequence of all prices between the signal and the capture. In particular, I cannot confirm from this image alone whether the stop was touched before the target.
The mathematics of the reference levels
The distance from entry to stop is 4,011.270 − 3,999.554 = 11.716. The first target is also 11.716 above entry, making its planned reward-to-risk ratio 1:1. The second and third targets are approximately 2R and 3R, allowing for the displayed rounding.
The quote shown is 12.040 above the reference entry, or approximately 1.028R before costs. This is a price-distance comparison, not a realized return. Spread, commissions, slippage, position size and actual fills are absent from the capture. TP2 and TP3 are not demonstrated as reached.
The original evidence
Open the full-resolution capture to inspect the chart and the signal card together. The source image below is unchanged; it retains the original timestamps, prices, TradingView attribution and execution disclaimer.
Read the signal evaluation protocol and evidence classifications →
What makes this research
For me, research means keeping the question testable. A convincing chart is a starting point; a reproducible evaluation needs the original signal record, timestamped candles, a fixed rule for target-versus-stop ordering, and explicit trading costs. If both levels occur inside one candle, a lower-timeframe record or an ambiguity rule is required.
This case is a selected favorable observation, not validation of the entire system. A meaningful performance study must also count losses, expired signals, invalidated setups and unresolved cases using the same rules. It must separate development data from a later evaluation period. One screenshot cannot establish a win rate or predict the next trade.
Continue the investigation
Explore the CY66 signal dashboard ↗, use the Research Lab candle analysis tools, and review position sizing and risk calculations. For the wider process behind my work, visit the CyGuru trading library and the educational guides.
Educational case study. The signal is historical and is not a current trading instruction.