

CASE 003 · CYGURU SAFE SIGNAL · TREND · 15M
From TP2 to TP3: CyGuru Safe Signal’s Gold Selloff Update
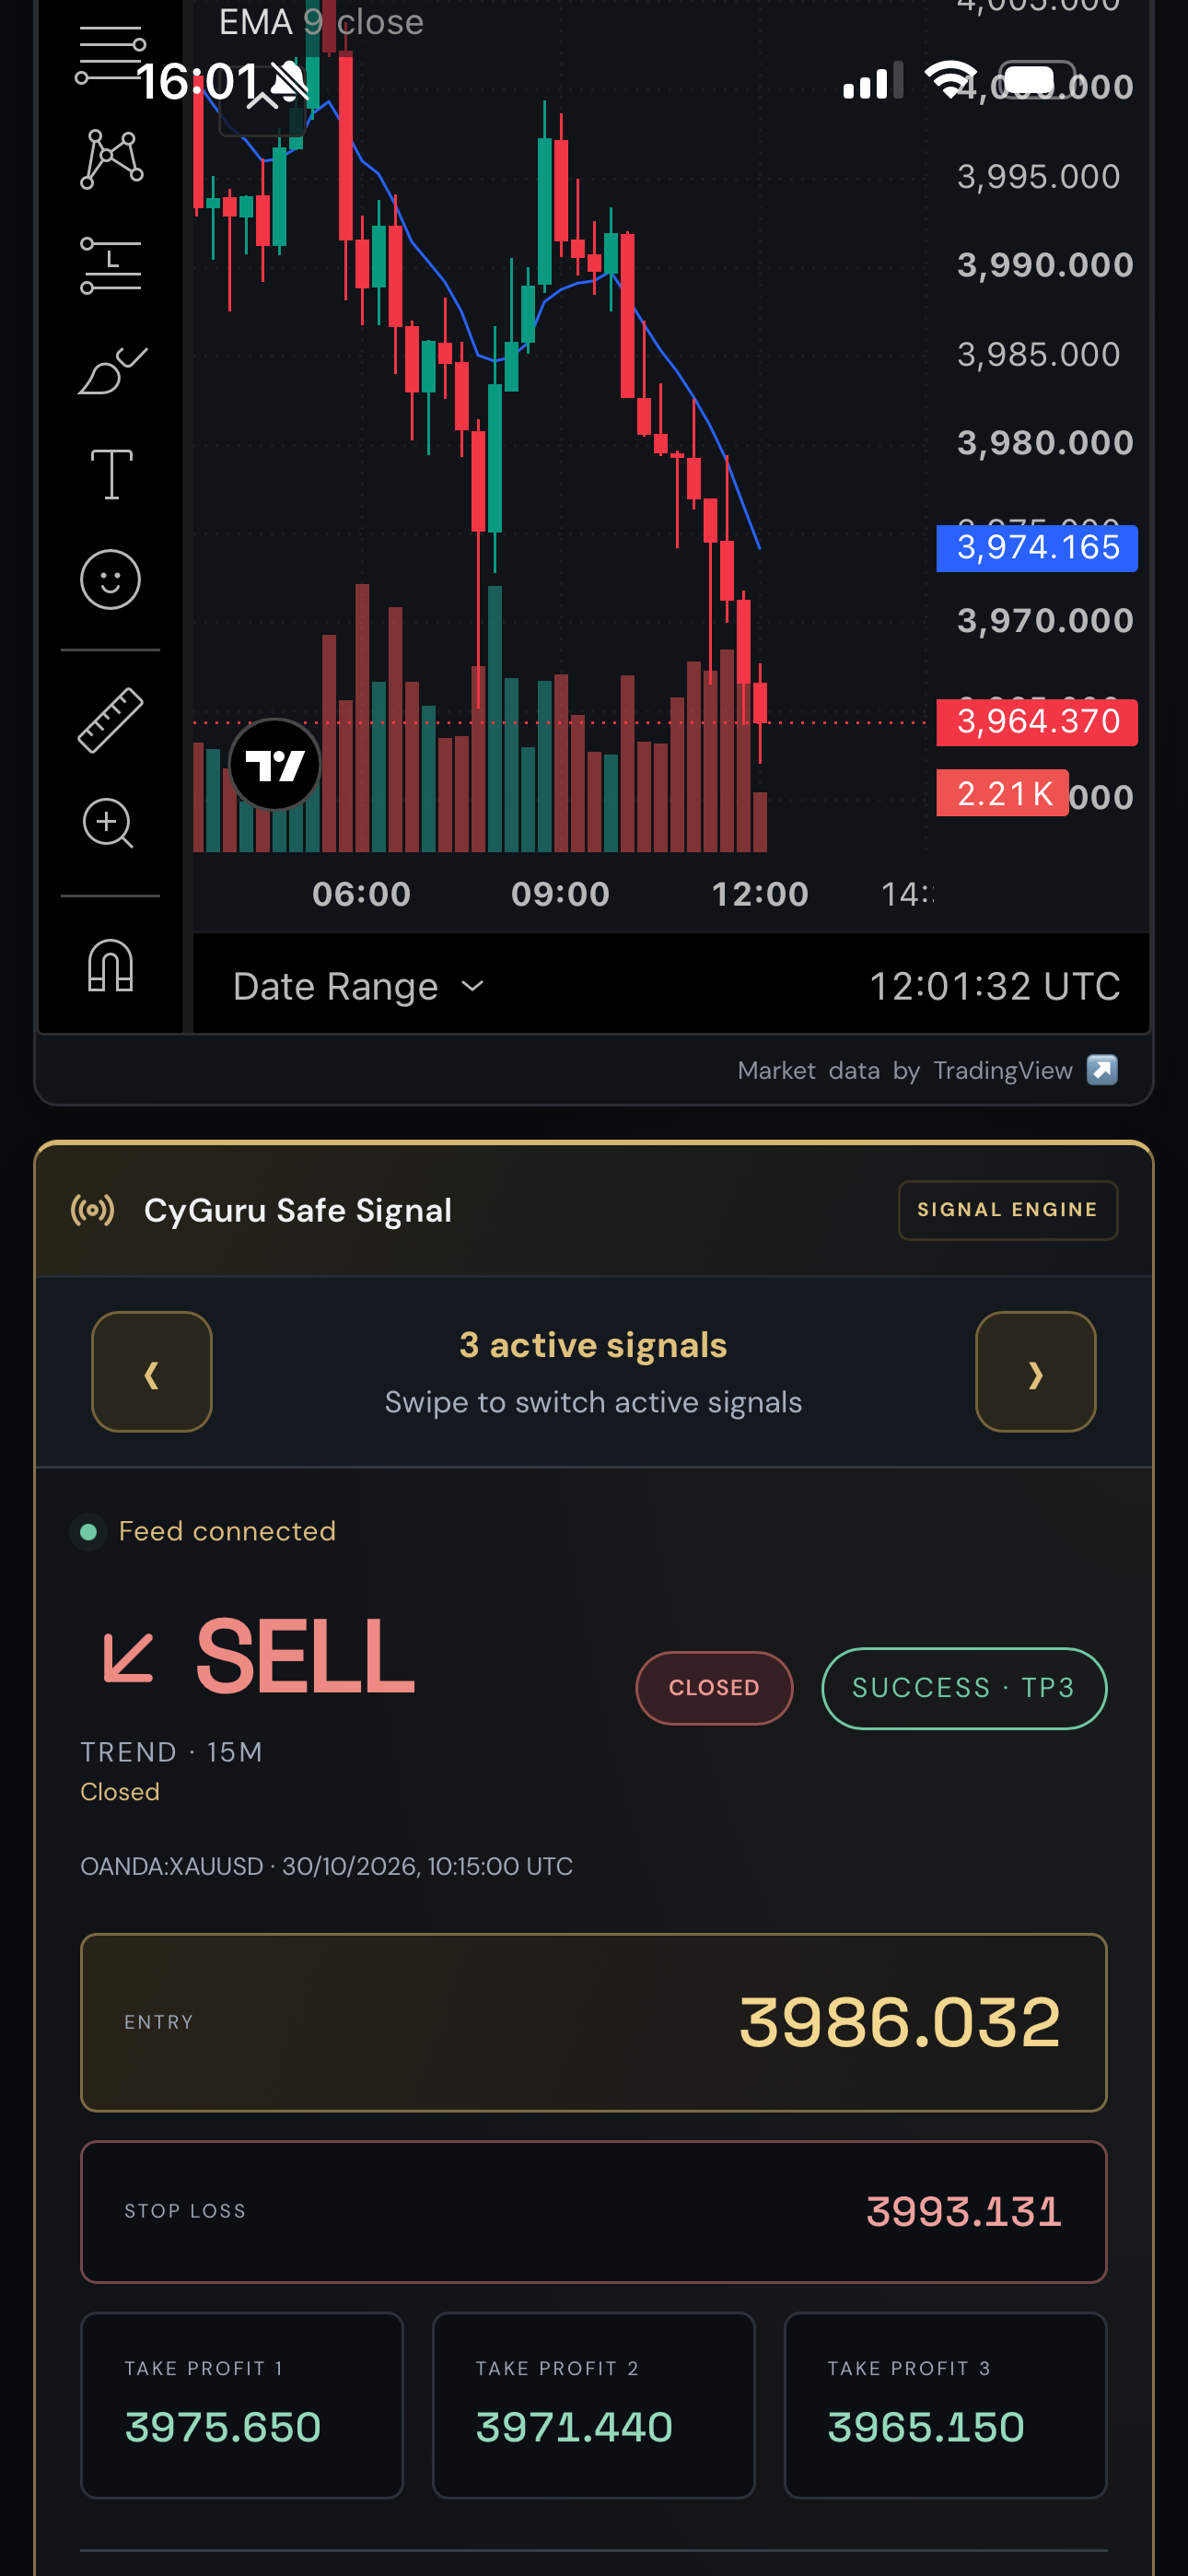
Updated case study: a later capture shows the same SELL signal marked CLOSED / SUCCESS TP3, with the quote below the third target. The original TP2 observation is preserved below.

DATED UPDATE · SAME SIGNAL
Update: TP3 reported, signal marked closed
New capture clock: 30 October 2026 · 12:01:32 UTC / 16:01:32 Dubai.
The later supplied capture identifies the same CyGuru Safe Signal SELL, timestamped 10:15 UTC, with unchanged entry, stop and target levels. It now displays CLOSED · SUCCESS · TP3, with the subtitle “Closed.” The quote shown is 3,964.370, or 0.780 below TP3 at 3,965.150. The contradictory TP1 tracking subtitle from the earlier image is no longer present in this capture.
The planned entry-to-TP3 distance is 3,986.032 − 3,965.150 = 20.882. Divided by the original 7.099 stop distance, that is 2.942R before costs. The displayed quote is 21.662 below entry, approximately 3.051R in reference price distance; it is not the demonstrated exit price or realized account return.
The two captures document progression from a quote beyond TP2 at 11:25:11 UTC to a quote beyond TP3 at 12:01:32 UTC. They do not identify the first TP3 touch. The latest clock is 1 hour, 46 minutes and 32 seconds after the signal timestamp; that interval is not a verified trade duration.
This updates the reported outcome of one signal; it does not add another winning trade to the archive. A complete signal log, price sequence and execution record are still required to verify stop-versus-target ordering, fills and returns. No additional news cause is inferred from the extension of the move.
Original edition · TP2 observation at 11:25:11 UTC
The analysis below records the information available in the first capture. Its TP2-only statements refer to that earlier observation and have been retained for a transparent chronology.
The useful question is not simply whether price moved in my direction. It is whether the signal, risk and outcome can be reconstructed under the same rules every time.
A second target in the afternoon observation
The CyGuru Safe Signal card in the supplied capture is labelled SELL · TREND · 15M, with a reference entry of 3,986.032 at 10:15 UTC. By the chart clock of 11:25:11 UTC, the displayed quote was 3,968.730. That quote is below TP2 at 3,971.440 and above TP3 at 3,965.150.
I am documenting this as a reported TP2 outcome, with a displayed price beyond the second target. The observation comes 70 minutes and 11 seconds after the signal timestamp; this is the elapsed time between the two printed clocks, not a verified time-to-target. It is also an intraday snapshot, not the closing result of the New York session.
This is a separate setup from the earlier 66 Hazem TP3 case: a different signal label, creation time, reference entry and stop. Both relate to the same trading day, so they should not be treated as independent proof that the system performs well across different market conditions.
The numbers behind TP2
| Level | Price | Price distance / reference risk |
|---|---|---|
| SELL entry | 3,986.032 | Reference |
| Stop loss | 3,993.131 | 7.099 adverse · 1R |
| TP1 | 3,975.650 | 10.382 favorable · 1.462R |
| TP2 | 3,971.440 | 14.592 favorable · 2.056R |
| TP3 | 3,965.150 | 20.882 favorable · 2.942R |
| Displayed quote | 3,968.730 | 17.302 favorable · 2.437R |
The calculation is explicit: initial risk = 3,993.131 − 3,986.032 = 7.099; planned reward to TP2 = 3,986.032 − 3,971.440 = 14.592. Dividing the latter by the former gives approximately 2.056R before trading costs.
The displayed quote is 2.710 below TP2 and 3.580 above TP3. The capture therefore supports a price observation beyond TP2; it does not demonstrate TP3. Neither 2.056R nor 2.437R is a verified account return. Position size, partial exits, spread, commission, slippage and actual execution are not shown. “Safe Signal” is the product’s name, not a guarantee of a safe or loss-free trade.
Reading the chart without inventing the strategy
The visible section shows a rebound followed by renewed selling and a large red candle near the right edge. The blue line is labelled EMA 9 close, with a displayed value of 3,979.914, above the quoted price. That is consistent with short-term weakness in this snapshot. It does not prove which conditions generated the signal: the capture contains the output, not the underlying code or an immutable alert log.
The last candle may still be forming. Its final range, close and tick count cannot be established from this image alone. The bar display also cannot identify institutional selling, liquidations or the total volume traded across the global gold market. I would not attach those explanations to the candle without separate evidence.
News context: a backdrop, not a timestamped trigger
A Reuters report dated 30 October, with a 09:04 UTC market observation, described gold weakness alongside oil-led inflation concerns and expectations of further Federal Reserve tightening. That context preceded the 10:15 UTC signal. It provides a plausible backdrop; it does not identify a new headline that triggered this particular decline.
My interpretation is that a technical continuation setup can develop while investors are repricing an already-known macroeconomic story. The research task is to separate that background from a fresh surprise. I have not verified a specific economic release or headline arriving between 10:15 and 11:25 UTC that explains this move, nor synchronized dollar and Treasury-yield observations for the same window. I therefore do not claim a single news cause.
The earlier case study records the prior Fed and PCE information timeline. For the analytical distinction between policy expectations, yields and currencies, see Gold, rates and the dollar. Context can help frame a hypothesis; a causal claim requires a more precise event study.
The supplied capture and its limits
The card displays “SUCCESS · TP2,” while its subtitle still reads “TP1 reached · tracking” and its state remains “ACTIVE.” These labels conflict. The supplied image is not independently authenticated against the original platform record; the badge is treated as a reported status, not as proof of a fill or a completed trade.
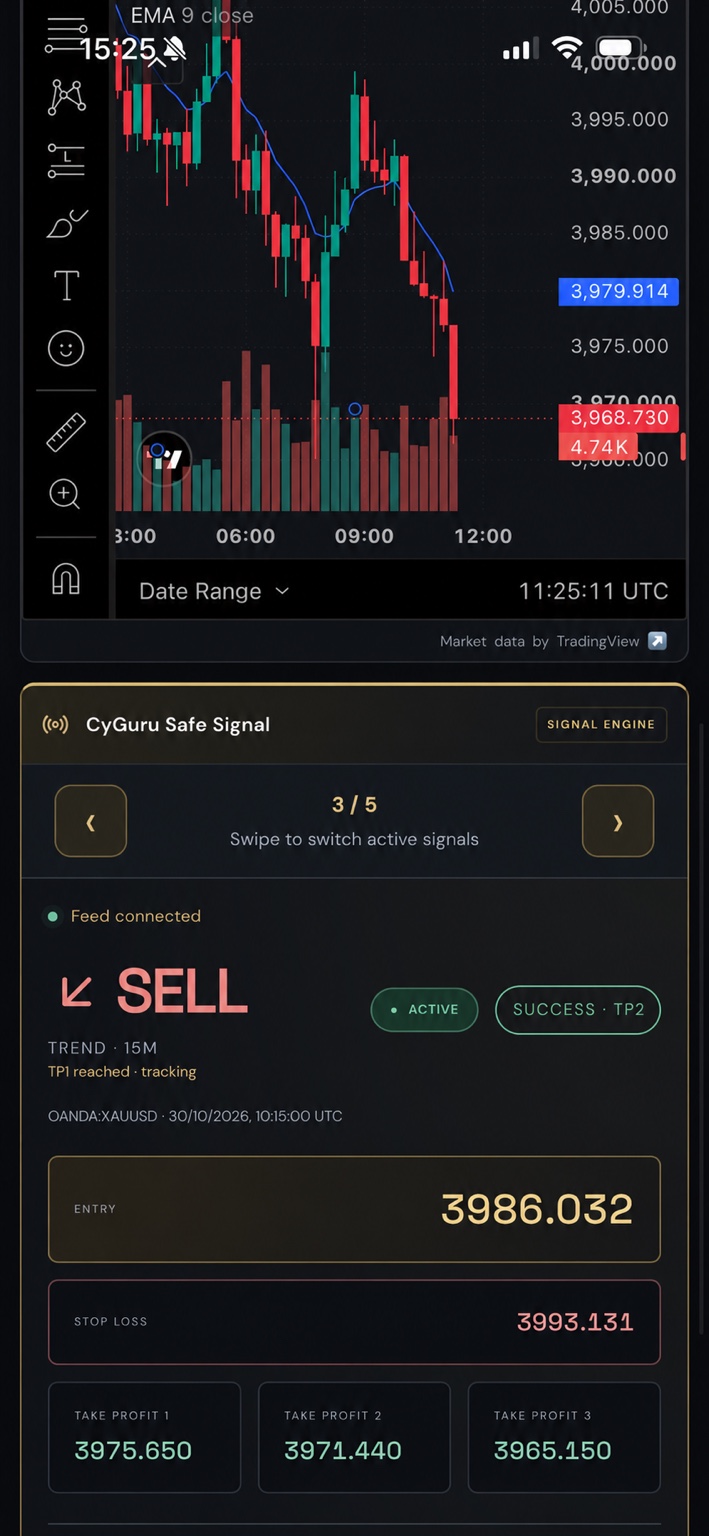
A later quote below a short target does not settle whether the stop was touched first. For that, I need the original signal record and complete subsequent bid/ask history. If stop and target both fall inside one candle, finer data or a predeclared ambiguity rule is necessary. The Research Lab evaluation protocol sets out that distinction.
What this case adds to the research
This observation gives us a concrete second-target question to test: did the stated setup reach its objective before invalidation, under realistic execution assumptions? A reproducible review would preserve the alert, reconstruct the path, apply costs and record any partial exits. The same process must be used for losing, expired and unresolved signals.
Several favorable captures from one selloff are not a strategy validation. Their outcomes can be strongly related because they share the same underlying market move. A meaningful study needs the full signal population, different regimes and a later evaluation period that was not used to develop the rules.
That is the direction of the science I am developing: less reliance on a persuasive screenshot, more emphasis on records another reader can inspect. Explore the candle analysis tools, the backtesting guide, and the position-sizing tools. My broader framework is presented in the CyGuru Gold Trading Library.
Selected educational case study. Updated reported outcome: CLOSED / TP3; execution and price sequence unverified. The author develops and promotes CyGuru signals and educational products. Original observation: 30 October 2026, 11:25:11 UTC. Latest supplied observation: 12:01:32 UTC. This is not a current instruction to trade.