

66 HAZEM SIGNAL · BUY · PULLBACK · 5M
From Pullback to Expansion: Gold Moves Beyond All Three Hazem Targets
Two captures follow one gold BUY setup through a powerful upward expansion on 3 November 2026.

This is the science I am developing. Put the levels on record, follow the sequence, and measure the expansion against the risk defined at the start.
One setup, two observations
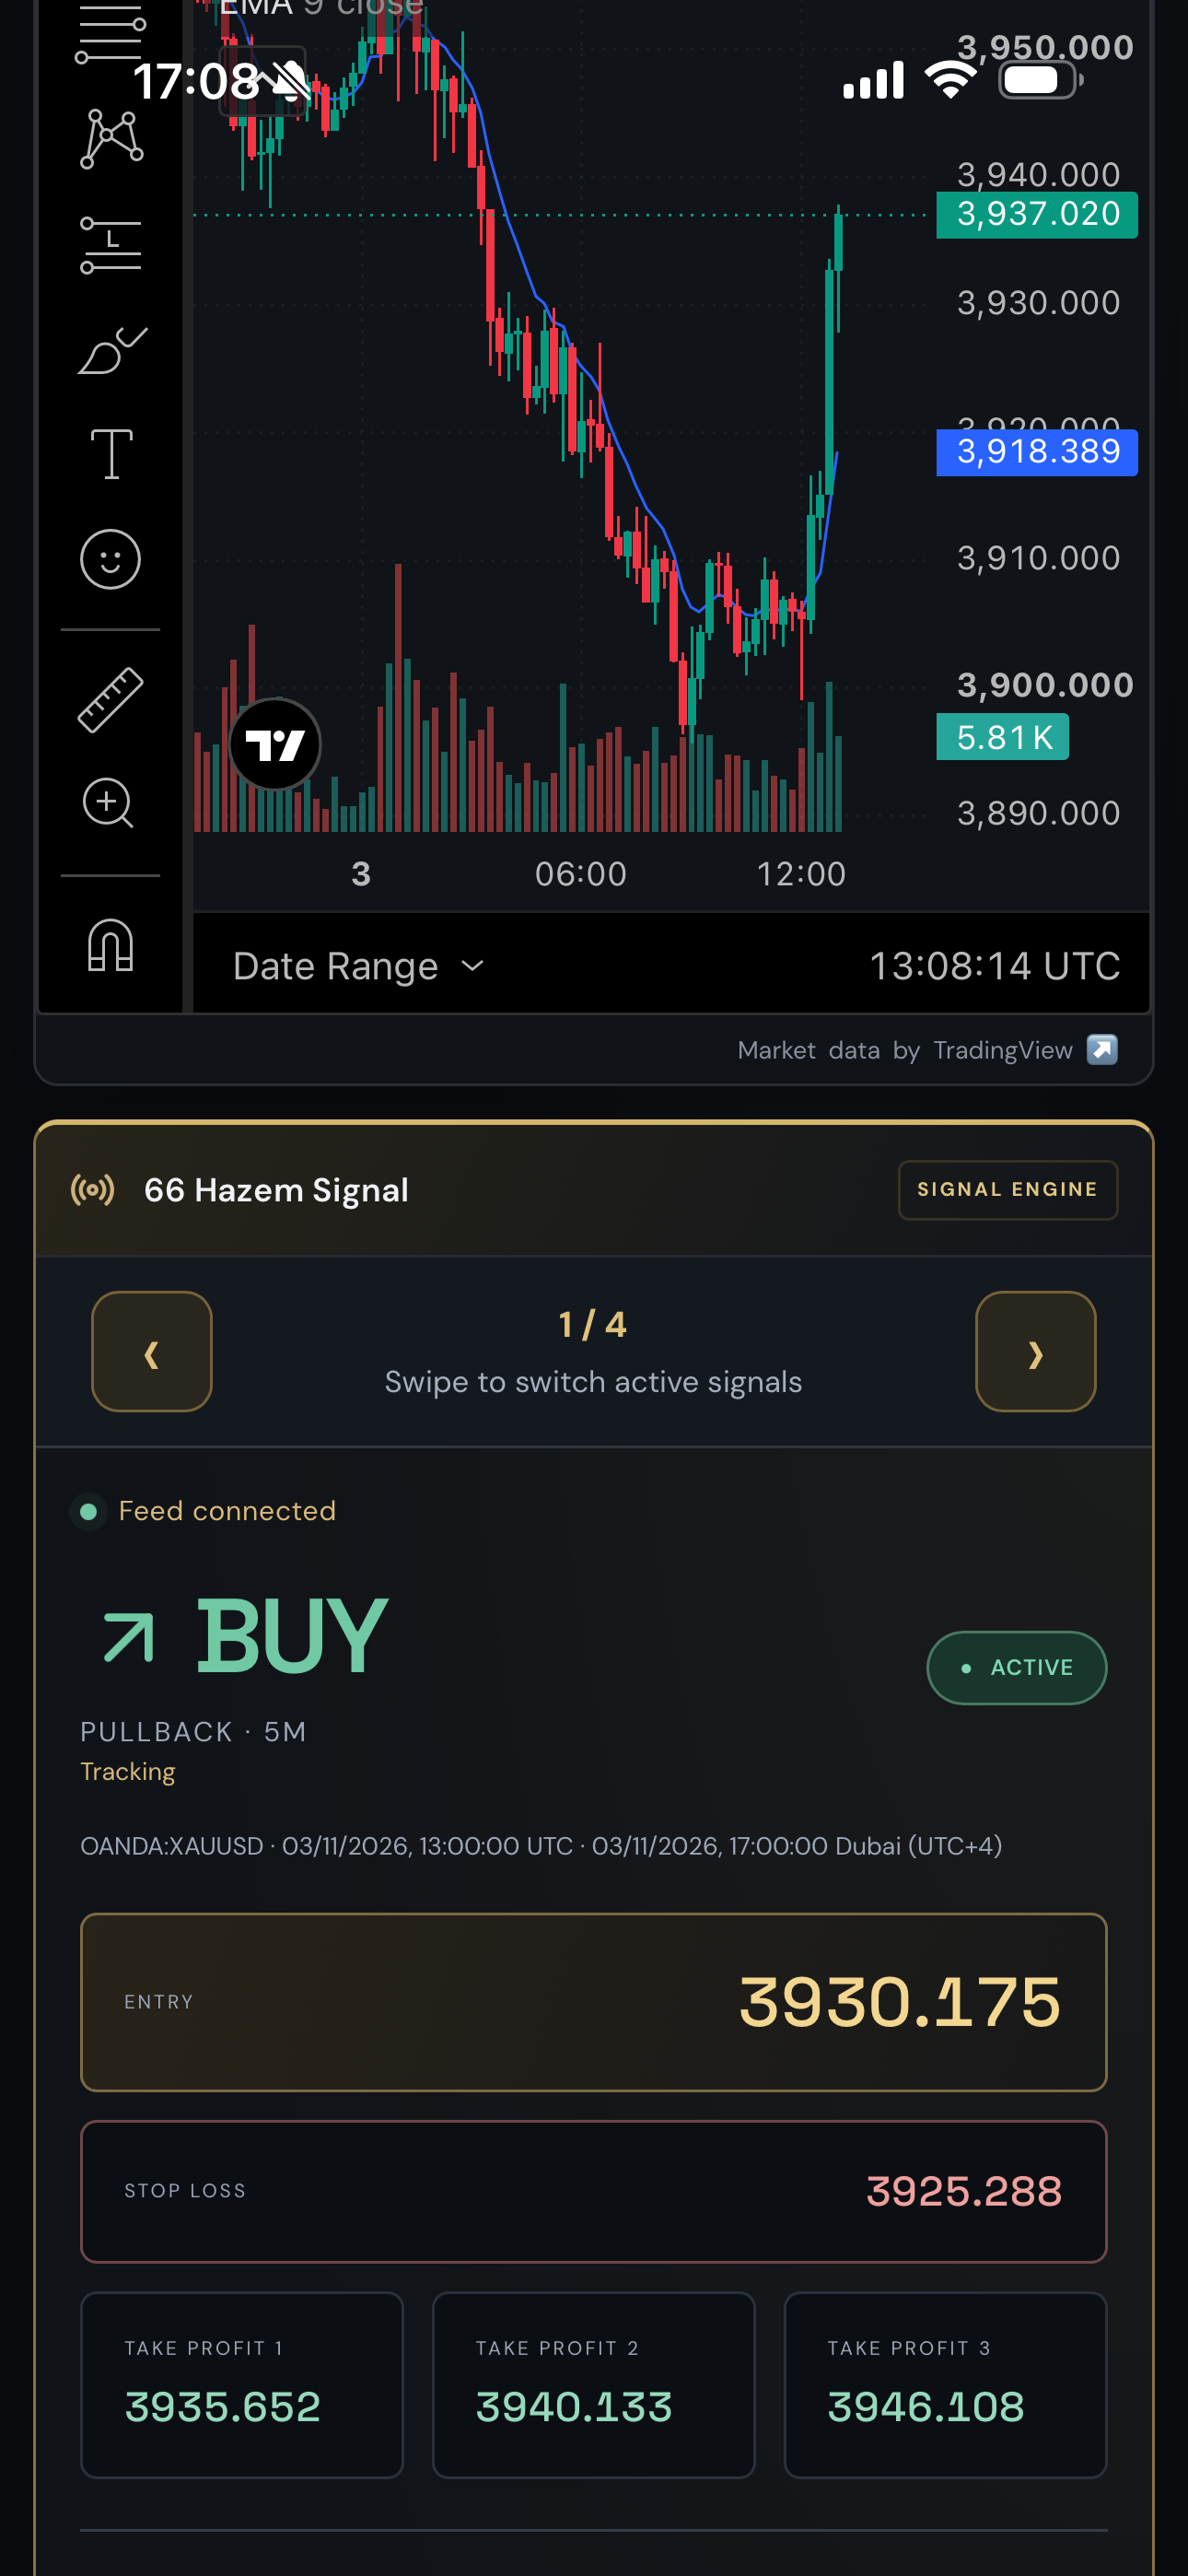
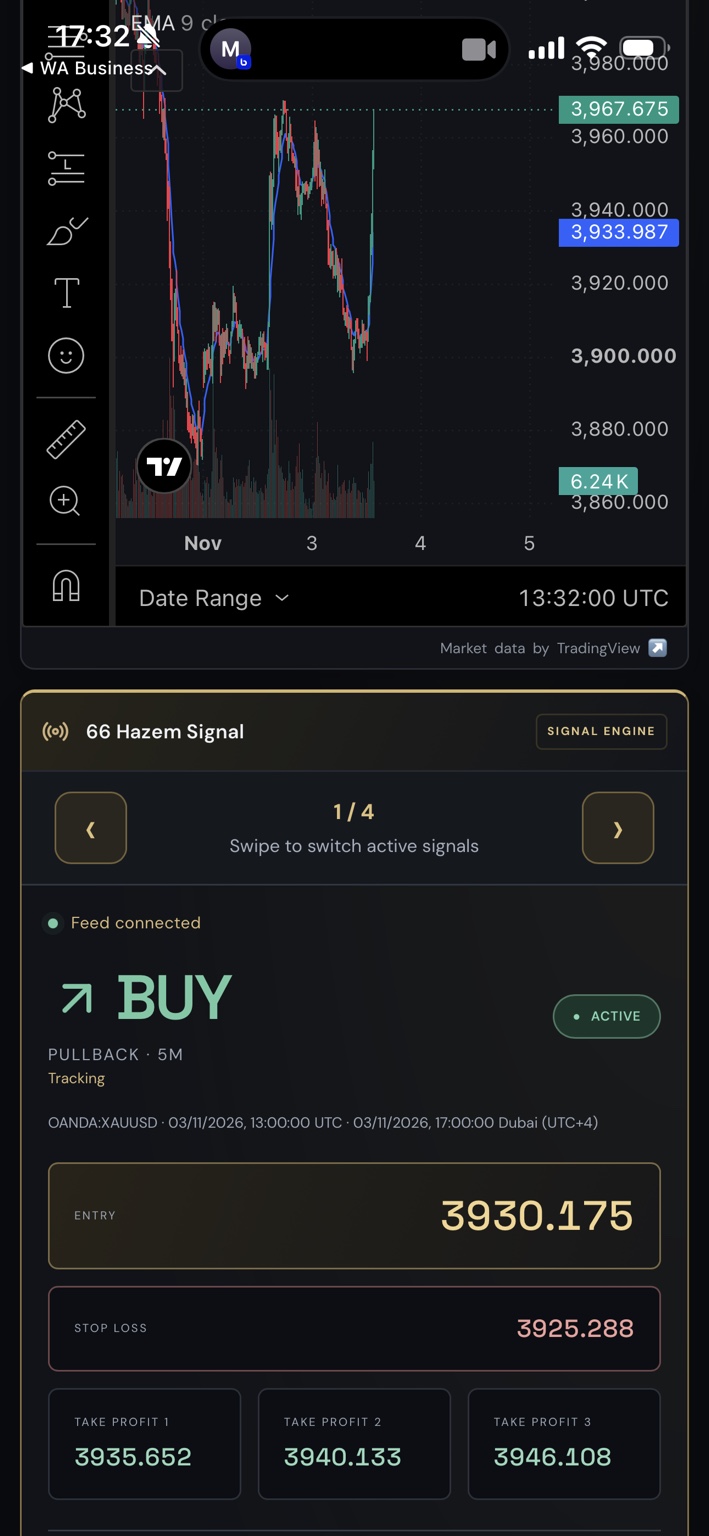
My CY66 dashboard displayed a 66 Hazem Signal BUY for OANDA:XAUUSD, labelled PULLBACK · 5M, at 13:00 UTC on 3 November. The first capture’s clock reads 13:08:14 UTC. Its chart quote is 3,937.020. The later capture reads 13:32:00 UTC and shows 3,967.675. Both cards carry the same entry, stop, targets and signal timestamp. I am recording one selected case with follow-up evidence.
The early quote stands above TP1. The later quote is above all three displayed targets. The move is substantial relative to the reference stop distance, and that is the result worth examining here. Both cards continue to display ACTIVE / Tracking. Their visible status remains part of the evidence.
The plan and the price distances
| Reference field | Value | Distance from entry |
|---|---|---|
| BUY entry | 3,930.175 | Reference |
| Stop | 3,925.288 | −4.887 |
| TP1 | 3,935.652 | +5.477 · 1.121R |
| TP2 | 3,940.133 | +9.958 · 2.038R |
| TP3 | 3,946.108 | +15.933 · 3.260R |
| 13:08:14 quote | 3,937.020 | +6.845 · 1.401R |
| 13:32:00 quote | 3,967.675 | +37.500 · 7.673R |
The reference risk is 3,930.175 minus 3,925.288, or 4.887 per ounce. Dividing each favorable price distance by 4.887 expresses it in R. The later quote is 21.567 above TP3. Its approximately 7.673R distance is an observation at capture time. An exit at the planned third target would instead correspond to approximately 3.260R before trading costs. Position size, partial exits, spread, commissions and actual fills determine an account result.
What the chronology adds
The first observation comes eight minutes and fourteen seconds after the displayed signal time. The second comes thirty-two minutes after it. Between those observations, the quoted price advances by another 30.655 per ounce. This gives a dated progression through the move rather than relying on a single final image.
The capture times do not identify the exact instant each target was first touched. They also leave the intervening bid and ask sequence incomplete. To establish an executable outcome, I would retain the original alert receipt time, the applicable engine version, tick or sufficiently fine intrabar prices and the order history. Those records would resolve whether the stop was reached before a target and whether a quoted level was available for an actual exit.
Why the pullback structure interests me
The visible chart shows a decline toward the 3,900 area followed by a fast upward expansion. My interpretation is that the engine identified participation in the developing recovery. The BUY reference around 3,930 also tells us the setup belonged to an advance already underway. Its quality should be judged from the recorded entry and risk, rather than assigning it the entire rally from the chart’s low.
A small stop distance makes favorable movement look large in R. That also makes spread, timing and slippage proportionately important. A rigorous comparison would measure how the same setup behaves during weaker recoveries, sudden reversals and ordinary sessions. The attractive example gives us a specific sequence to reconstruct. A complete sample determines whether that sequence represents a repeatable advantage.
The original captures
The next evidence to preserve
This selected favorable case cannot establish an overall success rate. The research log needs all eligible signals, including stopped, expired and unresolved records, evaluated with the same costs and expiry rules. Overlapping alerts should retain their shared market context. The two images here document the same signal and should be counted together.
Read the evaluation methodology, explore gold backtesting and the risk tools, and continue through the CyGuru trading library. Follow future dated studies through reader updates.
Evidence supplied by the author, who develops and promotes CY66 and CyGuru educational products. Selected quote observations from 3 November 2026. Independent execution records were unavailable. Latest capture clock 13:32:00 UTC.