

DOCUMENTED CASE · HAZEM · PUBLIC TERMINAL
From Signal to Evidence: Hazem Reaches TP2 in the CyGuru Gold Terminal
A gold signal becomes useful research when its progress can be inspected. This selected SELL record shows an entry-activation report followed by two target events—and makes the third target’s unconfirmed status equally visible.
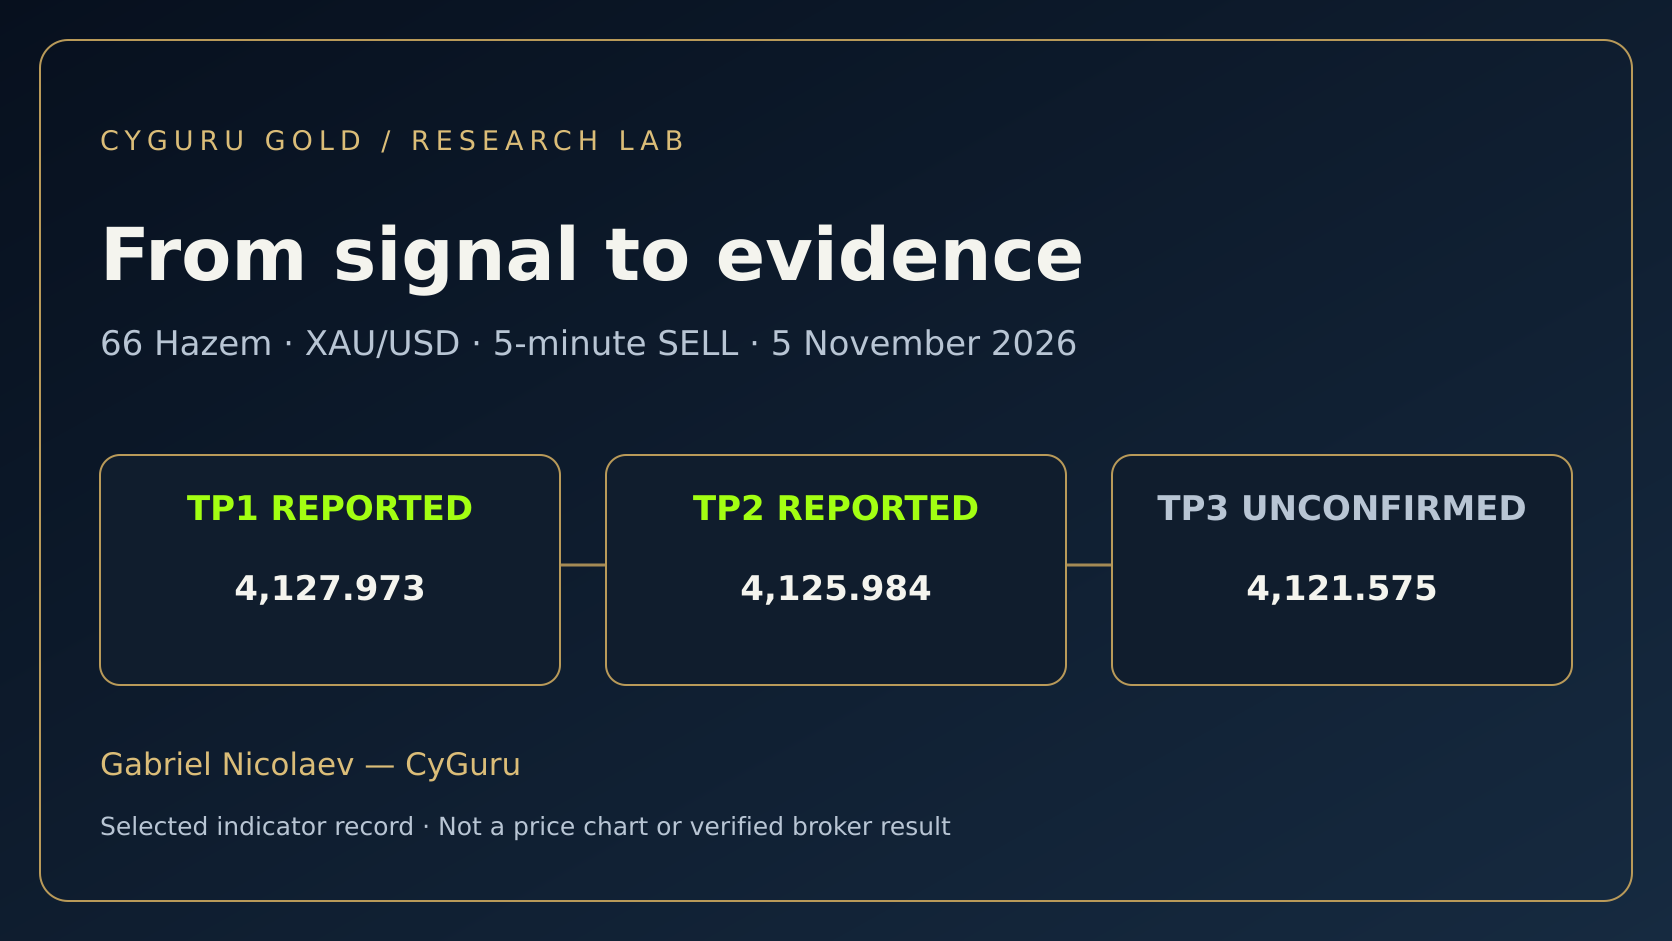
The record: a five-minute gold SELL setup
On 5 November 2026 at 09:20 UTC, or 13:20 Dubai, the CYGURU.GOLD gateway recorded a 66 Hazem Signal SELL setup on OANDA:XAUUSD, using the five-minute timeframe. Its recorded setup classification was SWEEP. The reference entry was 4,130.403, with a stop at 4,132.259 and three predefined targets.
A shared indicator name or a similar price does not make two records the same trade hypothesis. This case is identified by the signal ID ending in 1793870400000; matching updates to that identifier is essential to keeping the event history accurate.
| Field | Price | Evidence at cutoff |
|---|---|---|
| SELL entry | 4,130.403 | Activation reported |
| Stop | 4,132.259 | Planned invalidation level |
| TP1 | 4,127.973 | TP1_HIT recorded |
| TP2 | 4,125.984 | TP2_HIT recorded |
| TP3 | 4,121.575 | No TP3 confirmation in the preserved record |
The sequence is more informative than a green label
The public signal endpoint contained four events for this exact record when checked on 5 November 2026 at 10:42:58 UTC / 14:42:58 Dubai. The timestamps below are the recorded event times, not independently measured broker execution times.
| Event | UTC | Dubai · UTC+4 |
|---|---|---|
| Signal created | 09:20:00.000 | 13:20:00.000 |
| Entry activation reported | 09:30:08.071 | 13:30:08.071 |
| TP1 reported | 09:35:23.070 | 13:35:23.070 |
| TP2 reported | 09:36:15.571 | 13:36:15.571 |
The interval between creation and the activation report was just over ten minutes. TP2 followed approximately six minutes after the activation report. These intervals help explain why “signal received,” “entry activated” and “target reached” should remain separate states. Publishing a setup is not itself evidence that its entry condition occurred.
At the evidence cutoff, the stored status was TP2, the highest reported target was 2, and entry activation was confirmed by the indicator events. TP3 was not confirmed. The live terminal may subsequently change; this article preserves the dated observation rather than silently rewriting it as a later result.
What the levels imply—and what they do not
The reference stop distance is 4,132.259 − 4,130.403 = 1.856. The planned distances to TP1 and TP2 are 2.430 and 4.419 respectively: approximately 1.309R and 2.381R, where one R is the entry-to-stop distance. TP3 would represent a planned distance of 8.828, approximately 4.756R; it is not an achieved outcome in this case record.
These are calculations from published levels, not account returns. The record does not establish position size, spread, commissions, slippage, partial exits or a trader’s fills. Reaching the second reference target cannot be converted into a realized profit percentage without those additional facts.
An innovation in how the public reads a signal
The ambition behind the CyGuru Gold terminal is to make a signal understandable as a developing record. Instead of leaving the reader with an isolated BUY or SELL message, the interface brings direction, timeframe, entry, stop, targets and reported milestones into one panel. A visitor can inspect what has been reported and what remains unresolved.
In this capture, TP1 and TP2 carry visible green REACHED labels. TP3 remains NOT CONFIRMED. That distinction is a practical design contribution: the interface does not need to make every target look successful to communicate useful progress. It also avoids presenting an unavailable confidence score or trap-risk estimate as a measured number.
The terminal supports browsing multiple signal records and automatic feed refresh. Dubai and UTC timestamps help readers relate updates to their own session. The adjacent TradingView chart supplies visual market context, while the signal panel reports the indicator’s event history. A chart quote and an indicator update are different evidence sources; displaying them together does not make them interchangeable.
I describe this as innovation in public access, presentation and traceability—not as a claim that a new interface guarantees a trading advantage. Its value is that a reader can ask better questions: Which signal is this? Was entry activation reported? Which target event arrived? What information is still missing?
The original capture and preserved data
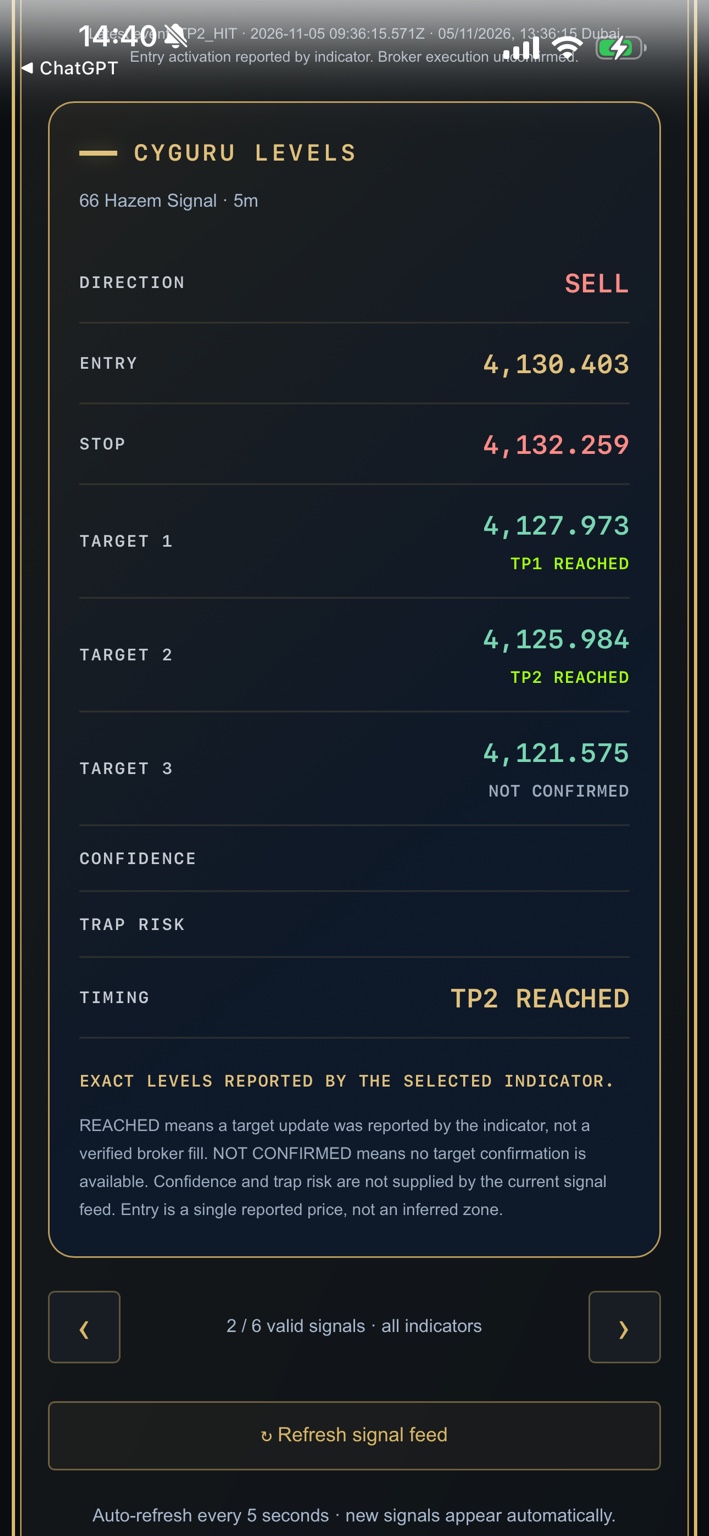
Download the preserved public signal record → · Inspect the current public signal feed →
A selected case, not a system win rate
This is a deliberately selected favorable example. It demonstrates a recorded lifecycle through TP2, not the overall profitability or reliability of Hazem. A system-level evaluation must include losing, expired, cancelled and unresolved signals, preserve the same rules across the sample and examine costs. The Research Lab methodology explains the evidence distinctions used in this archive.
The next research question is operational as well as financial: how consistently do emitted updates arrive, match their original signal and remain intelligible to the reader? Clear state reporting is part of the infrastructure required to study that question. It is not a substitute for a complete, independently assessed performance dataset.
Explore the workspace
Open the Gold Terminal, follow the broader source-based reporting in Gold Intelligence, and study risk and market structure in the educational guides. The trading books develop the wider framework behind this work. Reader feeds and publication updates are available through Follow CyGuru Gold.
Source notes
Primary case evidence: the owner-supplied terminal screenshot and the CYGURU.GOLD public signal endpoint, checked at 10:42:58 UTC / 14:42:58 Dubai on 5 November 2026. A snapshot of the matching record is linked above. The endpoint and the terminal are parts of the same reporting system; they are not independent confirmations. All R multiples are arithmetic derived from the stated levels. No external news cause, broker execution, TP3 outcome or overall win rate is asserted.